Question: For a normal distribution, two standard deviations on each side of the mean would include what percentage of the total population?
Answer: A half sigma is 19.1%, 1 sigma is 19.1+ 15, and 2 sigmas are 19.1% + 15% + 9.2% + 4.4 % = 47.7%
Now double it to account for the other side of the median: 47.7% * 2 = 95.4%.
So, a process that follows the normal distribution inside can expect to have 95.4% of its values fall within 2 sigmas of the mean.
Question: When calculating the Cp index, what does the standard deviation represent in the formula Cp = (USL – LSL) / 6σ?
(A) The tolerance interval (B) The confidence interval for the result (C) The range of the process (D) The variance of the index
Answer: (C) The range of the process is represented by 6 sigmas, or standard deviations in the Cp Index equation. Remember, 6 standard deviations account for nearly all eventualities (assuming normal distribution) of the process. 6 sigmas is a good approximation of the range of outcomes.
The USL – LSL (the upper and lower limits) could be representative of the tolerance interval. I’m not familiar with anything called the tolerance interval but the upper and lower limits are set by what is considered acceptable by the client. And those fit.
Variance is a specific term in Six Sigma. You can calculate variance by squaring the standard deviation, a term that does not appear in the Cp equation so we can eliminate this answer.
Question: As we calibrate our Measurement System to assure accurate data we frequently encounter Bias which is the ______ of a measured value from the ____ value.
(A) Spread, Mean of the population (B) Deviation, hoped for (C) Deviation, true (D) Spread, idea
Answer: (c) Deviation, true. This is a definition question. See MSA.
Question: This formula Z = (X – µ)/σ is used to calculate a Z score that, with the appropriate table, can tell a Belt what ________________________.
Answer
A) Ratio the area under the curve is to the total population
B) Number of Standard Deviations are between X and μ
C) The Median of the sample population is
D) Proportion of the data is between X and μ
Answer: Proportion of the data is between X and μ. This is a definition question. See Z Scores.
Question: When a Belt is developing a Macro Process Map to define a complex process he will frequently include activities across various department to capture all the appropriate activity. He will use _____________ to show which department is responsible for which steps in the process.
A reminder that if you want to take these questions yourself you can via my online system. If you haven’t take then baseline exam yet, do so. You can find one available in all of my courses both paid and free.
As great as the baseline practice exams aren’t enough. You need to find more questions.
Your assignment this week is to find and practice more questions for these topics.
Assignment for PYSSGB Students
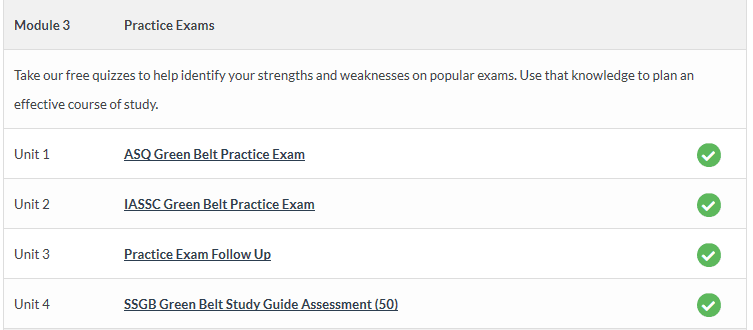
If you are a Pass Your Six Sigma Green Belt member, take all of the individual topic quizzes as well as the the cumulative exams for Module 5. Let me know what you think. (Want to become a member? Sign up here.)
What Do You Think?
I’d love to know what you think about the material you need to know in these sections. Please take a minute to share your thoughts below. I’ll use these responses to decide the best way to improve the site to help the most number of people.
Next Time
Next week we will dive into the Analyze Phase of DMAIC.
I’d love feedback on how you thought the second week went. What was good, what could be better?
We also covered the Feynman technique – in my opinion the best way to fully master any material. That’s where you take a minute and write everything you know on a topic from scratch then go to the page and see how what you wrote compares to what is there.
If you didn’t have a chance to review those topics, go back now and catch up. The context supplied with those topics gives an excellent foundation for our studying.
Week 3: Six Sigma Measure Phase
Today we’re starting with the Measure Phase of Six Sigma’s DMAIC process. Just like the previous weeks, before we start I’d like to begin with a note that many different certifying bodies exist and I am trying to help people that are candidates in all of them. This means that I may refer to things that aren’t specifically on your exam.
Your Assignment
Here's what I'd like you to do.
First, you’ll need to log in to the site.
Free membership or paid, it doesn’t matter. You just have to be logged in. Buttons to sign up and log in are below.
Second, review the articles I list below.
These are the concepts I refer exam candidates to when diving into these particular sections.
Take a look.
If you’re not as strong as you’d like to be in that subject…
Read through, click around the resources I’ve listed, and learn more. If you have questions, post them on that page.
If you want to really improve your skills in a particular subject…
As I’ve mentioned before, the Feynman technique is Take a minute and write everything you know on a topic from scratch then go to the page and see how what you wrote compares to what is there.
For the next 2 weeks in the Measure and Analyze phases, I’d like you to focus on anchoring.
These topics can be difficult to remember due to sheer volume. So, a great way to remember them is to come up with an instance you would apply the technique in real life.
Here’s an example: Let’s say that you just can’t seem to remember when to use equations for sampling vs equations for a population.
If you take the time to either remember a real-world instance of when you did apply that equation (or invent a time you should or could have used that equation), you’ll stand a much better chance of remembering it.
Your assignment is to pick one topic that you are unsure of in this section and leave a comment on that topic’s page describing when you’ve seen it in action – or you could have / should have seen it in action.
I’d love to know what you think about the material you need to know in these sections. Please take a minute to share your thoughts below. I’ll use these responses to decide the best way to improve the site to help the most number of people.
Next Time
Next time we will dive into the specific requirements of these topics across of a few popular certifying bodies (ASQ, IASSC, Villanova).
1.4.4 The Seven Elements of Waste a. Overproduction, Correction, Inventory, Motion, Overprocessing, Conveyance, Waiting. 1.4.5 5S a. Straighten, Shine, Standardize, Self-Discipline, Sort