The Pareto Chart (Pareto Diagram) is a graphical tool to map and grade business process problems from the most recurrent to the least frequent. In other words, this helps to identify the most frequently occurring problems or separate the vital few from the trivial many.
Vilfredo Pareto, an Italian economist who discovered that 80% of Italy’s wealth was owned by 20% of the population, invented the Pareto Chart to depict these findings. Hence, this Analysis is also known as the 80/20 rule.
The Pareto Chart is a combination of both the bar chart and the line chart. The bar chart shows the frequency of occurrence or defects, whereas the line graph displays the cumulative data percentage in descending order.
A Pareto Chart (also known as a Pareto Diagram) is a bar chart that re-orders the categories, ranking them from the most significant total occurrences to the smallest.
In Process Analysis, this helps identify the most frequently occurring problems or defects – or separate the vital few from the useful many.
The correct ranking for the Pareto chart categories is from left to right; likewise, you can think of it as highest to lowest.
When You Should Use a Pareto Chart (Pareto Diagram)
- See Pareto Analysis for a fuller discussion.
- When analyzing the frequency of root cause data and focusing on the most significant contributors (the vital few).
- When wanting to understand a broad cause by looking at the component pieces.
- When you need an effective way to share a lot of information quickly.
How to Make a Pareto Chart (Pareto Diagram)
How to Construct a Pareto Chart
The primary purpose of the Pareto chart is to identify the most frequent defects and errors, which can then be counted and categorized. Below are the steps to create a Pareto chart using the Pareto Analysis.
- Determine the categories you wish to monitor, though be sure to pick one that impacts the business.
- Establish a measurement system, and also essential to use the same measure for all contributors.
- Determine the timeline that data covers for the Pareto for all the categories.
- Collect data for all the categories in two columns, categories (example: type of defects) in the first column and corresponding frequency (total count of each defect category) in the second column.
- Draw a bar graph with categories (for example, type of defects) on the x-axis and frequency on the y-axis.
- Re-order the categories in descending order (from largest to smallest categories).
- Then, calculate the cumulative percentage of each category in descending order, i.e., Individual defect count/ total defects count *100.
- Draw another vertical axis on the right side of the graph with values from 0 to 100%.
- Plot the cumulative percentage of each category on the x-axis.
- Now, join all the points, and it will form a curve.
- Analyze the graph. Identify the top 80% on the Y-axis. This point on the x-axis divides the vital few defects (left side) and many trivial defects on the right side.
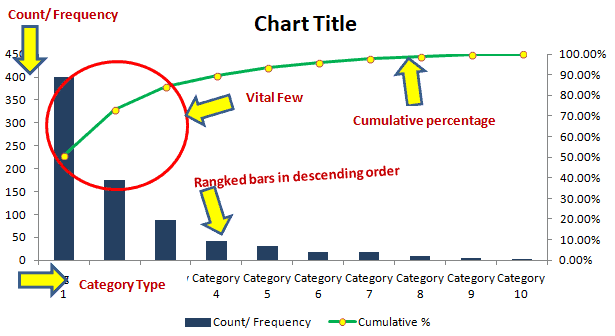
Example of a Pareto Chart in the DMAIC Process
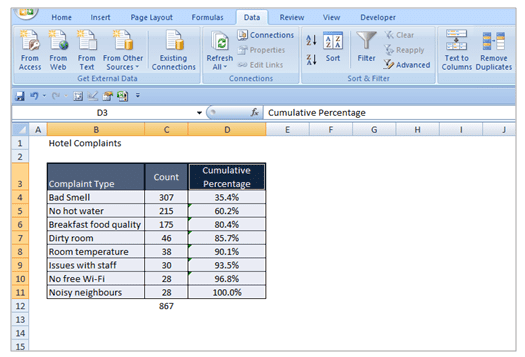
Example: A XYZ group runs franchised hotels across the USA. In this case, the hotel management collected customer stay experiences from the top eight revenue-generated locations via an online survey. The team then analyzed the results using Pareto analysis.
The following are the results from eight locations:

How to Make a Pareto Chart in Excel
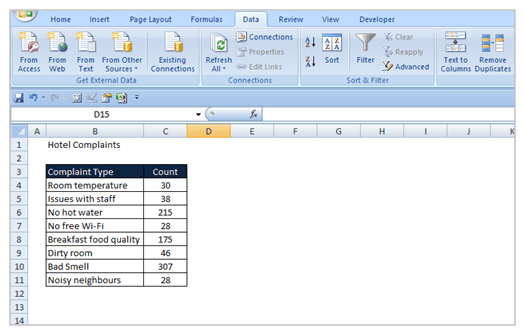
Step 1: Write “Complaint Type” in cell B3 and “Count” in cell C3. Below them, enter all the customer complaint categories and enter their respective total count in column C.
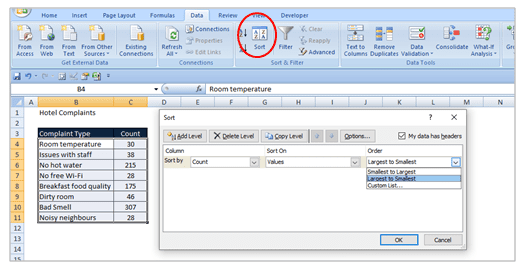
Step 2: Select the whole range (including titles). Go to Data ==> select sort and ensure that “My list has header row” is checked. In “Sort By” select “Count” and in the “Order” drop-down, select “Largest to Smallest”, then click on “Ok.” Now, it will sort the count in descending order.
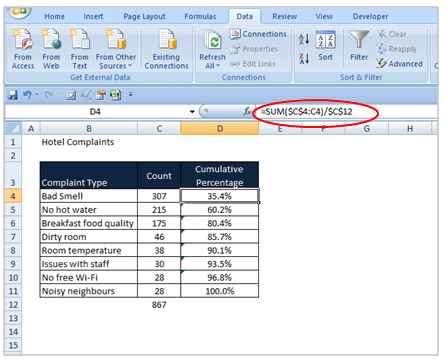
Step 3: Add the total categories count in cell C12. Then, add the “Cumulative percentage” column next to the Count column and calculate the cumulative percentage as shown as per the formula in the D4 cell. Drag D4 below rows to apply the same formula for all the categories.
Step 4: Again, select complaint type, count, and cumulative percentage columns, including titles.
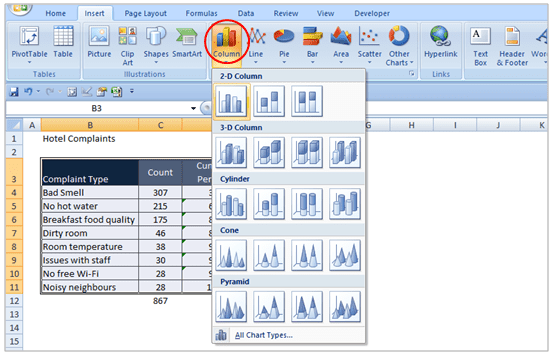
Step 5: Go to Insert ==> Chart. Make sure that “Column” is selected as the chart type, and then select the “Clustered column” chart from the 2-D Column chart.
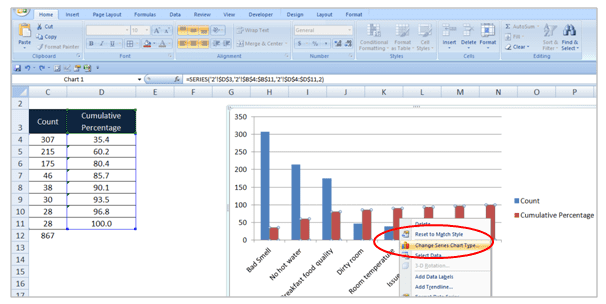
Step 6: Then, click on the cumulative percentage bar graph from the two bar graphs and right-click on it ==>select “change series chart type.”
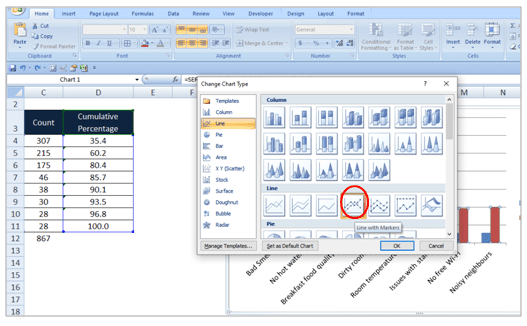
Step 7: On the “Change Chart Type” ==> Choose “Line with a marker” chart under Line type and then click on “ok.”
Step 8: Select the line graph and right-click on it ==> select “Format data series.”
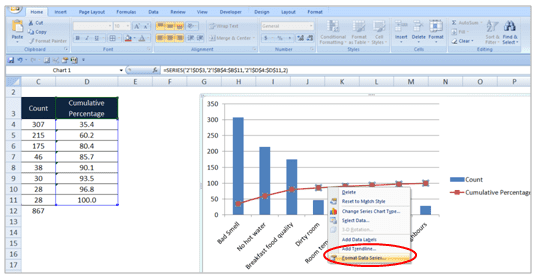
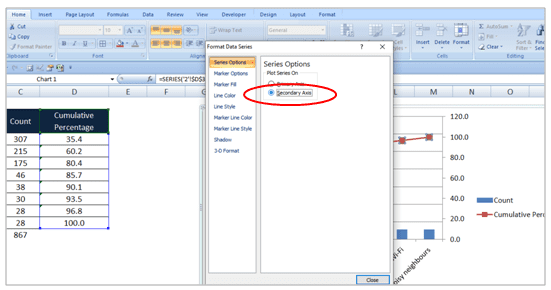
Step 9: Under “Series Option” ==>select the “Secondary Axis” radio button. Also, right-click on the secondary axis ==>select “Format Axis.” Under “Axis Options,” change the “Maximum” option to “Fixed” and then enter the value as 100.
Step 10: Add titles on the chart and also include axis labels. Analyze the data and identify top customer complaints. In other words, use the Pareto Analysis to find 80% of the customer complaints.
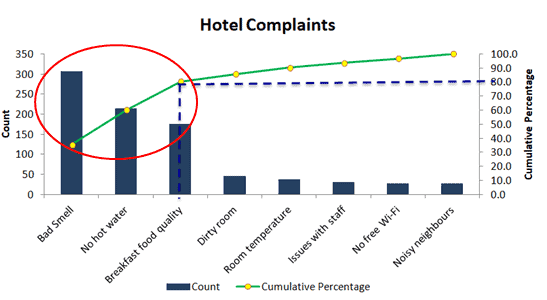
Interpret the Pareto graph:
The above diagram shows that the top three categories (bad smell, no hot water, and breakfast food quality) contribute to 80% of customer complaints.
Pareto Chart (Pareto Diagram) Example
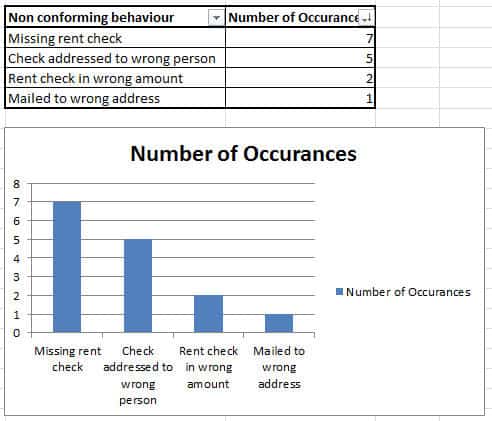
It can be easily created by tallying a check sheet, making a bar chart out of it, and re-ordering it.
Pareto Chart Template Download
C: Pareto Charts are used to identify and quantify the source of a problem. Affinity diagrams help reduce processes to a few key steps. Control charts can show you your process has gotten out of control but won’t identify the source or quantify it. QFD is a planning process for adapting a client’s needs to your plans.
When you’re ready, there are a few ways I can help:
First, join 30,000+ other Six Sigma professionals by subscribing to my email newsletter. A short read every Monday to start your work week off correctly. Always free.
—
If you’re looking to pass your Six Sigma Green Belt or Black Belt exams, I’d recommend starting with my affordable study guide:
1)→ 🟢Pass Your Six Sigma Green Belt
2)→ ⚫Pass Your Six Sigma Black Belt
You’ve spent so much effort learning Lean Six Sigma. Why leave passing your certification exam up to chance? This comprehensive study guide offers 1,000+ exam-like questions for Green Belts (2,000+ for Black Belts) with full answer walkthroughs, access to instructors, detailed study material, and more.

Comments (10)
What does a Pareto chart tells us?
A pareto chart tells us those occurances that make up 80% of the cumulative total which are the “significant many” to focus on identifying root cause.
Great reply! Thanks for taking the time to answer!!
A bar graph representation of a frequency distribution is commonly referred to as what?
A bar graph is commonly referred to as a histogram
What should a well constructed histogram reveal to you?
A well constructed histogram should tell you categories that make up the total of all occurances and the rank order of those categories.
Hello Ted,
Thanks for the post. Just wondering myself, why 80-20 and not 70-30 for instance? I see it is useful to prioritize and also to detect we’re not addressing the right attributes, but why these numbers, may it come from observation in nature, experimental?
All the best,
Ignacio
Good question, Ignacio.
Here’s a quote that I found on the history:
Attribution for quote.
This is a great way to visualize how many different tasks are being done.