How to determine baseline project sigma is one of the key aspects of the Measure phase. Baseline sigma calculation is part of the Data collection plan.
Sigma, denoted by the symbol σ (a Greek alphabet), represents the standard deviation of a population. Primarily, it characterizes the dispersion of a set of data values with respect to the mean. It refers to the mathematical concept of standard deviation.
Six Sigma is derived from the normal or bell curve in statistics, where each interval shows one sigma or one standard deviation. Moreover, Sigma is a statistical term that refers to the standard deviation of a process about its mean. In a normally distributed process, 99.73% of measurement will fall within ±3σ, and 99.99932% will fall within ±4.5σ.
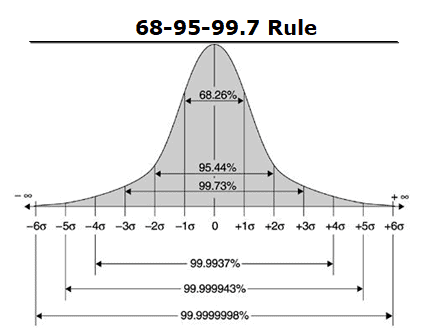
The 68-95-99.7 rule, also known as an empirical rule used to remember the percentage of values that lie within a band around the mean in a normal distribution with a width of one, two, and three standard deviations, respectively.
Why Would You Want Your Baseline Sigma to be 1, 2, or 3?
You would want your baseline sigma to be 1, 2, or 3 because those often reveal a bad process, and you would like your team to be able to see an improvement in the process at the end of the project.
What is the Reason behind Calculating the Sigma Value?
The value in making a sigma calculation is that it abstracts your level of quality enough so that you can compare levels of quality across different fields (and different distributions.) In other words, the sigma value (or even DPMO) is a universal metric, that can help you with the industry benchmark/competitors.
Does the Data Type (Discrete/Continuous Data) Have Any Effect on Calculating the Sigma Value?
Data type does NOT have an effect on the sigma value so long as we are counting the total number of opportunities and defects properly.
How to Determine the Baseline Project Sigma for Discrete Data
You can determine the process capability through the number of defects per opportunity. The acceptable number to achieve Six Sigma is 3.4 Defects Per Million Opportunities (DPMO).
- Unit – the item produced or created.
- Defect – anything that causes a failure (i.e. misses the requirements of the customer.)
- Opportunity – the number of critical quality measures we are counting on each opportunity in defects. If there are 4 types of defects, this value is 4.
- DPO = Defects/(Units * Opportunity)
- DPMO = (Defects / Units * Opportunities) * Total 1,000,000
- Yield = 1-DPO (It is the ability of the process to produce defect-free units).
Determine if Zero defects are needed or if there is partial credit.
- If the process is only considered correct if there are no defects at all (100% correct), then use the DPMU calculation (defects per million units). DPMU = (Defects / Units) * 1,000,000
- If partial credit is received for meeting some of the requirements: use the DPMO calculation (defects per million opportunities). DPMO = (Defects / Units * Opportunities) * Total 1,000,000
Examples of Baseline Sigma for Discrete Data
Example: XYZ is a commercial flight carrier operating 10,000 flights a day. There are three defect opportunities like late arrival, lost luggage, and poor in-flight experience. Let’s assume 10,000 defects have been identified. Calculate process sigma level.
- Unit or sample size = 10,000 flights a day
- Defects types = 3 (could be a late arrival, lost luggage, poor in-flight experience).
- Opportunities = 10,000 flights * 3 kinds of defect opportunities = 30,000
- Defects: 10,000 defects
- DPMO = (Defects / Units * Opportunities) * 1,000,000
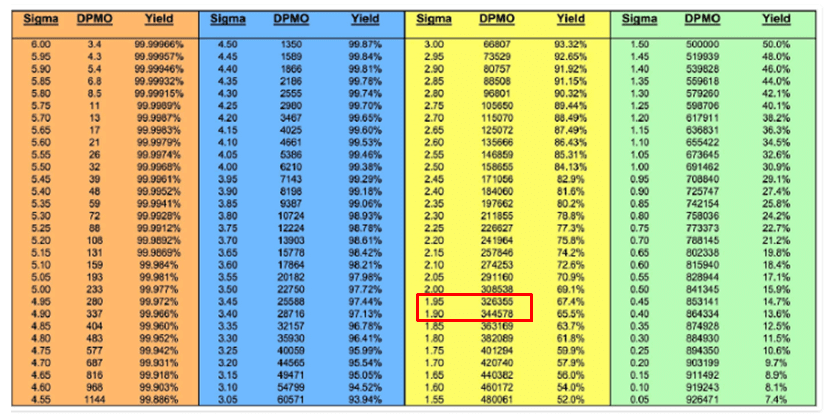
- DPMO= (10000 /10000*3) * 1,000,000 = (1/3) * 1M. = 333,333 defects per million opportunities.
- From the below chart, 333,333 DPMO translates to a sigma between 1.95 and 1.9.
- Or in excel use the formula = NORMSINV (1- (defects/ sample size * Number of defect opportunities per unit in the sample) + 1.5
Excel Template Download to Determine Baseline Sigma for Discrete Data
Question: A company is currently operating at a 2 sigma level of quality. What will be the number of defects expected if they are able to improve to a 3 sigma, 4 sigma and 5 sigma level of quality?
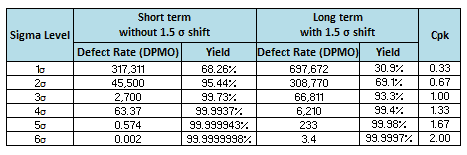
Answer: A sigma of 2 equates to 308,538 defects per million opportunities or 69.2% yield. Further, A Sigma of 3 = 66,807, a sigma of 4 = 6,210, and a sigma of 5 = 233. (refer above table).
How to Determine Baseline Project Sigma for Continuous Data
Process Capability determines if a process meets the needs of the customer. Process capability compares the output of an in-control process to the specification limits. We can say the process is capable when almost all the measurements fall within the specification limits. Cp and Cpk are considered short-term potential capability measures for a process.
In Six Sigma, we want to describe the quality of a process in terms of sigma because this gives us an easy way to talk about how capable a process is at using a common mathematical framework.
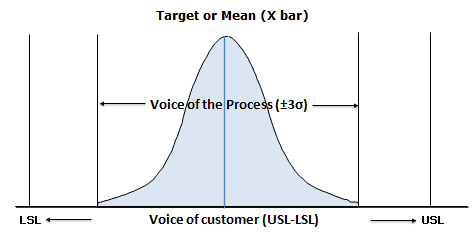
Cpk is a measure to show how many standard deviations the specification limits are from the center of the process.
- Cplower = (Process Mean – LSL)/(3*Standard Deviation)
- Cpupper = (USL – Process Mean)/(3*Standard Deviation)
- Cpk is the smallest value of the Cpl or Cpu: Cpk= Min (Cpl, Cpu)
The main purpose of Cpk is to determine how well a process performs when compared to its specification limits and the natural variability of the process. A larger Cpk is always better–it infers a lower probability of any item being outside the specification limits.
Process sigma = 3* Cpk. Hence, we generally want a Cpk of at least 1.33 [4 sigmas] or higher to satisfy most customers.
Examples of Baseline Sigma for Continuous Data
Example: The specification limit of rubber sheets is 5±1cm. The operator randomly recorded 4 subgroups of values every half an hour in three shifts. While the average mean is 4.7, and the short-term pooled standard deviation is 0.2 cm. Calculate the process sigma level.
- USL=6cm
- LSL = 4cm
- Standard deviation σR= 0.2 cm
- Process mean = 4.7cm
- Cplower = (Process Mean – LSL)/(3*Standard Deviation) = 1.16
Cpupper = (USL – Process Mean)/(3*Standard Deviation) = 2.16 - Cpk = min (Cpu, Cpl) = 1.16
- Sigma = 3 * 1.16 = 3.5
Excel Template Download to Determine Baseline Sigma for Continuous Data
Why Use Sigma Instead of Percent?
Why can’t we just use the percentage reduction in the defects to assess the process rather than the sigma value?
The answer is that, of course, you can. Many people do. But it has to make sense for your business.
However, measuring the change in terms of sigma allows you to judge improvements and opportunities in a more consistent manner.
Important Videos for How to Determine Baseline Project Sigma
When you’re ready, there are a few ways I can help:
First, join 30,000+ other Six Sigma professionals by subscribing to my email newsletter. A short read every Monday to start your work week off correctly. Always free.
—
If you’re looking to pass your Six Sigma Green Belt or Black Belt exams, I’d recommend starting with my affordable study guide:
1)→ 🟢Pass Your Six Sigma Green Belt
2)→ ⚫Pass Your Six Sigma Black Belt
You’ve spent so much effort learning Lean Six Sigma. Why leave passing your certification exam up to chance? This comprehensive study guide offers 1,000+ exam-like questions for Green Belts (2,000+ for Black Belts) with full answer walkthroughs, access to instructors, detailed study material, and more.

Comments (12)
Hello
Formulas are wrong! Should be as below:
DPMO (Determine if Zero defects are needed)
If 100% correct: use the DPMU calculation (defects per million units)
DPMU = (Defects / Units) * 1,000,000
If partial credit: use the DPMO calculation (defects per million opportunities)
DPMO = DPO*1,000,000 = (Total Defects /Total Opportunities)* 1,000,000
=(Total Defects / (Opportunities per unit * Total Units)) * 1,000,000
Thanks, Victor. You were right. I updated the post and added an example. Thanks!
How can I calculate baseline sigma when the DPMO is already given?
Hi Moreno,
Just look at the chart above and find the corresponding Sigma level that equates to your DPMO.
Thanks, Ted.
Estimating long-term sigma from short-term observations is not achieved by adding an arbitrary shift of 1.5. The short-term measurements are your best long-term bet. A process can shift by much more than 1.5. It can also shift by much less.
As the argument is summarized here https://www.gigacalculator.com/articles/what-is-six-sigma-process-control-and-why-most-get-it-wrong-1-5-sigma-shift/ sigma shift doesn’t make much sense, especially outside Motorola’s then manufacturing process where it might have had an empirical basis. Reporting a 6 sigma process as 4.5 sigma makes just about as much sense as reporting a 4.5 sigma process as 6 sigma.
Yes George,
Considering the practical challenges in terms of the time and effort in obtaining the long term process capability, it has been agreed that during long term, one may expect a shift of the mean value by 1.5σ on either side of the mean will be an acceptable indication of the long term capability. Thus in order to attain a long term process capability of 4.5σ, we need to ensure a short term capability of 6σ.
At any given point of time, if we measure the process capability for a process, it will always be the “Short Term capability”. The short term denotes to process potential, when operated under a set of variations that are always expected to be inherent in the process at any point of time.
If the short term capability itself does not meet the expected requirements, there wouldn’t be a need to run a long term capability. Knowing that during the long term a process will get subjected to additional variations the could impact in the shifting of the mean value, it is important that the short term capability has to be adequately good enough to enable the process to accommodate additional variations in the long term, so that the long term capability will still meet the expected requirements.
Thanks
The Process Capability Index Cpk video by Six Sigma Pro Smart was excellent! Thank you, Ted!
Glad it helped, Debra!
The airline example landing at around 1.9 sigma from 333,333 DPMO was a great reality check, since seeing a number that low actually makes the case for improvement instead of just feeling like things are ‘fine’. I liked the reminder that discrete vs continuous data doesn’t change the math as long as you count defects and opportunities honestly. The hardest part for me is always defining what counts as a single ‘opportunity’ cleanly, did you have a rule of thumb for that?
Hi Miguel – Thank you very much for your thoughtful comment.
You have identified one of the most important, and often debated, aspects of calculating DPMO. My rule of thumb is that an opportunity should represent a distinct chance for a defect to occur that is both meaningful to the customer and consistently measurable. Once you define an opportunity, apply that definition uniformly across all units you measure.
For example, if you are evaluating airline arrivals, each flight might represent one opportunity for an on time arrival defect. If you are inspecting manufactured parts, each critical quality characteristic on each part could be considered a separate opportunity. The key is to avoid artificially increasing or decreasing the number of opportunities just to improve or worsen the calculated sigma level.
Consistency is usually more important than finding the “perfect” definition. A clear, repeatable definition allows you to establish a reliable baseline and measure improvement over time.
Be sure to write down the clear operating definition of what you decide the defect qualification to be.
Running a support desk taught me the same lesson as your baseline-sigma point — until we measured how ugly the starting numbers actually were, nobody believed there was room to improve. Deliberately baselining a “bad” process gives the team something visible to beat.
100%
One of my favorite question sets is “How do we know what we think we know? What data do we have to support and what data do we have to deny our assumptions?”
Can’t run a business for long on vibes. Eventually, reality matters.