
Welcome back to the 6 week Six Sigma Green Belt review.
Earlier this week we covered the Define Phase of DMAIC. We stepped through dozens of concepts in each. You can see that here.
We also reviewed what some of the most popular certifying organizations like ASQ, IASSC, and Villanova require you know about these topics.
Today we’re going to review some of the kinds of questions you may be asked on your exam around those topics.
Ready? Let’s dive in!
ASQ Six Sigma Define Phase Questions
Question: When in the process of trying to identify the Critical X’s for a LSS project a Belt creates a(n) _ because frequently it is 20% of the inputs that have an 80% impact on the output.
(A) Pareto Chart
(B) FMEA
(C) Np Chart
(D) X-Y Diagram
Answer: (A) Pareto Charts are used to identify and quantify the source of a problem. Also see FMEA, X-Y Diagram, NP Chart.
Question: A Belt utilized a diamond symbol in a Process Map she created for the process that was subject to her LSS project. By use of the diamond symbol she was showing a(n) _______________ point in the process.
(A) Ending
(B) Beginning
(C) Decision
(D) Repair station
Answer: (C) Decision. Definition question. See the flowchart symbol page here.
Question: A shoe manufacturing firm learned through a Lean Six Sigma project their boot soles could be made of a different material requiring two less steps in the process. Removal of these two steps yielded a monthly cost savings of $7,500. Therefore the reported financial savings for this LSS project were:
Question: Which of the following tools can be used to identify and quantify the source of a problem?
(A) Affinity diagram
(B) Control chart
(C) Pareto chart
(D) Quality function deployment
Answer: (C) Pareto Charts are used to identify and quantify the source of a problem. Affinity diagrams help reduce processes to a few key steps. Control charts can show you your process has gotten out of control but won’t identify the source or quantify it. QFD is a planning process for adapting client’s needs to your plans.
Your Assignment
Assignment for everyone
A reminder that if you want to take these questions yourself you can via my online system. If you haven’t take then baseline exam yet, do so. You can find one available in all of my courses both paid and free.
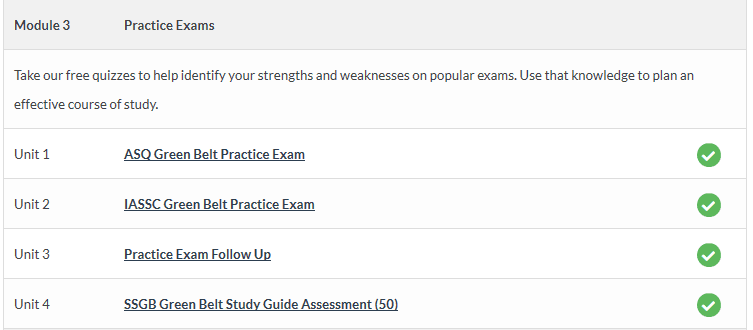
As great as the baseline practice exams aren’t enough. You need to find more questions.
Your assignment this week is to find and practice more questions for these topics.
Assignment for PYSSGB Students
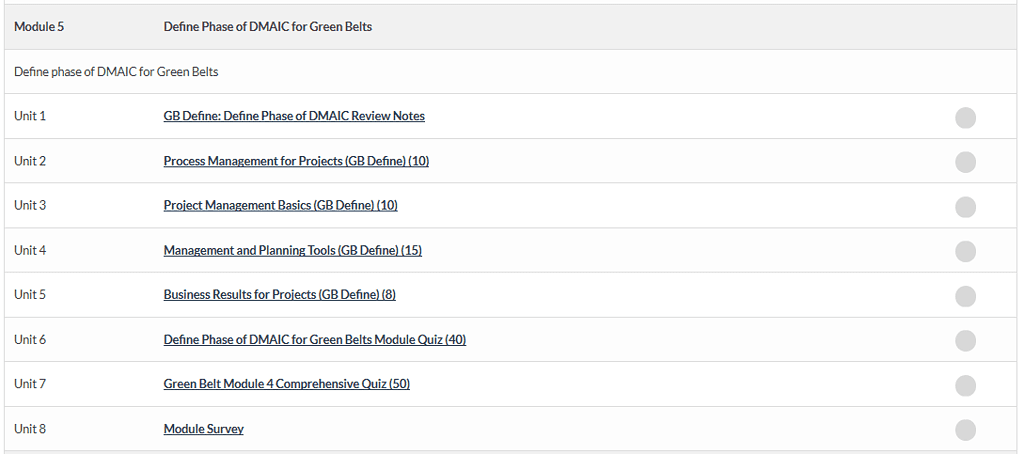
If you are a Pass Your Six Sigma Green Belt member, take all of the individual topic quizzes as well as the the cumulative exams for Module 5. Let me know what you think. (Want to become a member? Sign up here.)
What Do You Think?
I’d love to know what you think about the material you need to know in these sections. Please take a minute to share your thoughts below. I’ll use these responses to decide the best way to improve the site to help the most number of people.
Next Time
Next week we will dive into the Measure Phase of DMAIC. This is commonly around 20% of your score so it’s important you study up there as well.
I’d love feedback on how you thought the second week went. What was good, what could be better?
Happy studying, Ted