One of the biggest challenges Six Sigma students encounter is Hypothesis Testing. There are so many types! And there are so many different equations. How on earth are you supposed to be able to make sense of those problems, especially if you haven’t done word problems in years or ‘you’re just no good at math?’ Not to worry. I’ve got you covered. Here, I’ve put together the Hypothesis Test Study Guide.
Firstly, I aim to provide a cohesive overview of the types of hypothesis tests you’ll be responsible for on your Six Sigma exam, which hypothesis test to use under which circumstances, and an outline of how to do them.
First, a Word on Hypothesis Tests
These concepts fall under the phrase ‘simple but not easy.’
They’re simple because they are easily repeatable algorithms–or a series of instructions–you can repeatedly follow to get the desired result.
The not-easy part is that you must learn all the different types and decide when to use each.
If you can bake cookies, you can do hypothesis tests following this study guide.
Make fun of me all you want. My mental model for learning hypothesis tests for Six Sigma certification was baking.
Instead of thinking of hypothesis testing, consider baking. What if they asked you when to bake cookies instead of cake? Or bake bread instead of pie? And then imagine they were asking you questions about how to bake that pie, cookie, cake, or bread loaf.
There’s a time and a place for each of those baked goods. And also, there’s a time and a place for each hypothesis test.
All you have to do is decide what kind of baked good you want to cook and then pick the right recipe for the given situation!
Let’s dive in by learning about the different types covered in this Hypothesis Test Study Guide.
Furthermore, below, I give you a guided tour of the different types of hypothesis tests–baked goods. I introduce the variations of each type and when you’d want to ‘bake’ that item. I then link to other articles on this website for the ‘recipe’ and examples.
Hypothesis Testing Basics
Since this is a long article, I’ve added additional resources that can help provide an excellent foundation for the Hypothesis Tests Study Guide.
If you’re new to hypothesis tests or want a refresher, please see my Hypothesis Testing Overview and Basic Hypothesis Testing Process Overview here.
Another resource that is helpful to have on hand is the Hypothesis Testing Terminology page.
Okay, let’s dive into how you can pick which hypothesis test to use and when.
What You Need to Know about the Basics of Hypothesis Testing for Your Six Sigma Certification Exam
Six Sigma Green Belts
The ASQ Six Sigma Green Belt BOK requires the following:
Hypothesis testing Basics
Define and distinguish between statistical and practical significance and apply tests for significance level, power, type I and type II errors. Also, determine appropriate sample size for various test. (Apply).
The IASSC Six Sigma Green Belt BOK requires the following:
3.3 Hypothesis Testing
3.3.1 General Concepts & Goals of Hypothesis Testing
3.3.2 Significance; Practical vs. Statistical
3.3.3 Risk; Alpha & Beta
3.3.4 Types of Hypothesis Test
The Villanova Six Sigma Green Belt BOK requires the following:
Six Sigma Black Belts
The ASQ Six Sigma Black Belt BOK requires the following:
1. Terminology
Define and interpret the significance level, power, type I and type II errors of statistical tests. (Evaluate)
2. Statistical vs. practical significance
Define, compare and interpret statistical and practical significance. (Evaluate)
3. Sample size
Calculate sample size for common hypothesis tests (e.g., equality of means, equality of proportions, etc.). (Apply)
4. Point and interval estimates
Define and distinguish between confidence and prediction intervals. Define and interpret the efficiency and bias of estimators. Calculate tolerance and confidence intervals. (Evaluate)
The IASSC Six Sigma Black Belt BOK requires:
3.3 Hypothesis Testing
3.3.1 General Concepts & Goals of Hypothesis Testing
3.3.2 Significance; Practical vs. Statistical
3.3.3 Risk; Alpha & Beta
3.3.4 Types of Hypothesis Test
The Villanova Six Sigma Black Belt BOK requires:
Hypothesis testing
i. Fundamental concepts of hypothesis testing
1. Statistical vs. practical significance
Define, compare and contrast statistical and practical significance.
2. Significance level, power, type I and type II errors
Apply and interpret the significance level, power, type I and type II errors of statistical tests.
3. Sample size
Understand how to calculate sample size for any given hypothesis test.
ii. Point and interval estimation
Define and interpret the efficiency and bias of estimators; compute, interpret and draw conclusions from statistics such as standard error, tolerance intervals, and confidence intervals; understand the distinction between confidence intervals and prediction intervals.
The Three Types of Hypothesis Tests
You can divide the types of hypothesis tests you need into three main types:
- Tests for means, tests for variances, and tests for proportions
If this sounds intimidating, think of cookies, cake, and pie! ;’)
Let’s step through each type and how to select each one.
Note: Black Belt candidates, be aware that this article will focus on the hypothesis test you use on normal distributions. You will be responsible for those AND hypothesis tests you use under non-normal/ non-parametric distributions. Don’t worry. I’ve made a study guide for those tricky situations, too.
Hypothesis Tests for Means Study Guide
What You Need to Know about the Hypothesis Testing for Means for Your Six Sigma Certification Exam
Six Sigma Green Belts
The ASQ Six Sigma Green Belt BOK requires the following:
The Tests for means, variances, and proportions
Define, compare, and contrast statistical and practical significance. (Apply)Paired-comparison tests
Define and describe paired-comparison parametric hypothesis tests. (Understand)
Single-factor analysis of variance (ANOVA)
Define terms related to one-way ANOVAs and interpret their results and data plots. (Apply)
The IASSC Six Sigma Green Belt BOK requires the following:
3.4.1 1 & 2 sample t-tests
The Villanova Six Sigma Green Belt BOK requires the following:
Six Sigma Black Belts
The ASQ Six Sigma Black Belt BOK requires the following:
Tests for means, variances and proportions
Use and interpret the results of hypothesis tests for means, variances and proportions. (Evaluate)
The IASSC Six Sigma Black Belt BOK requires the following:
One Way ANOVA
a. Including Tests of Equal Variance, Normality Testing and Sample Size calculation, performing tests and also interpreting results.
The Villanova Six Sigma Black Belt BOK requires the following:
Test for means, variances, and proportions:
Apply hypothesis tests for means, variances and proportions, and then interpret the test results.Paired-comparison tests:
Define, determine applicability, and apply paired-comparison parametric hypothesis tests and also interpret the results.
What is a Hypothesis Test for Means?
Remember Mean, Median, and Mode? Furthermore, those are fancy statistical words for basic math principles. Mean is a synonym for average. So you might infer that a hypothesis test for means involves testing averages–and you’d be right!
When do you use Hypothesis Tests for Means?
You use a hypothesis test for means when you want to see if two sample populations have a characteristic that is, on average, the same.
A good example is when you need to know if you compare similar samples. For instance, if you needed to see if two samples were, on average, roughly equivalent before proceeding to use them in some manner.
Or you might want to see if the sample you just took is actually reflective of the whole population. For instance, if your sample is just the honors students, that sample is unlikely representative of the entire school.
Why should we run a complicated means test when we could look at the sample averages?
Why do we even need hypothesis tests? If we took a random sample and our sample mean of x differs from y, there’s a difference, right?
Sadly, it’s not that easy because we’re looking at a sample rather than the entire population. We need to account for sampling errors. We also want to know the statistical likelihood of a hypothesis at a given rate of certainty. Simply comparing the averages is a guess. Sometimes, you can get away with that. But if you want certainty, you will want to use a statistical test.
Note on sampling error:
Sampling error is the difference between a sample and the entire population. Thanks to sampling error, it’s entirely possible that while our sample mean is 330.6, the population mean could still be 260. Or, to put it another way, if we repeated the experiment, it’s possible that the second sample mean could be close to 260. A hypothesis test helps assess the likelihood of this possibility!
Minitab
What is Needed to Run Hypothesis Tests for Means?
Another way to think about these questions is to have a checklist and eliminate hypothesis tests when they don’t meet the criteria.
To perform a hypothesis test for means, you need two things:
How to do a Hypothesis Test for Means
Step 1: State a Hypothesis
State both your Null Hypothesis and alternative hypothesis.
Sometimes, you have to interpret the question yourself. Other times, it will be given to you. Sometimes, you can use the details in Step 2 to figure out what your hypotheses should be.
Remember, your null and alternative hypotheses must be mutually exclusive!
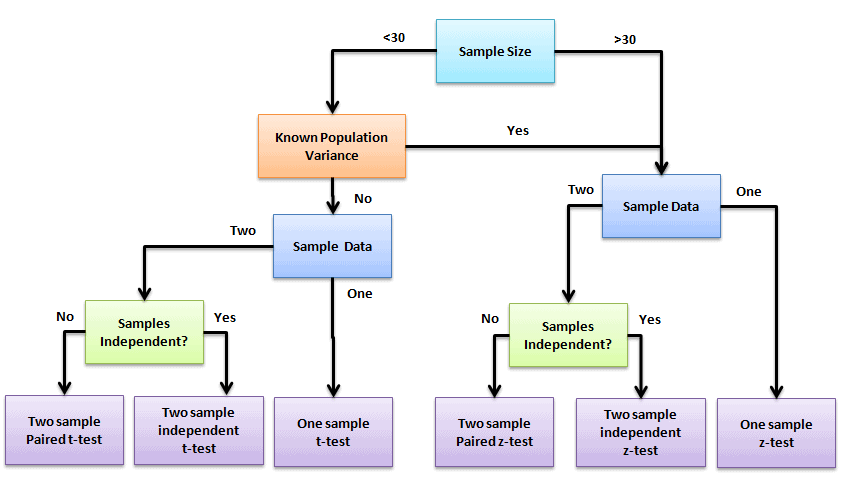
Step 2: Pick a type of means test!
There are several different types of means tests. So, be sure to pick the right one for the right job.
Z Test (Is the sample mean the same as the population mean?)
You use a Z test to compare if your sample mean is the same as the population mean. Use it to validate you have a good sample.
Like many hypothesis tests we cover here, you must have normal data.
Furthermore, the Z test is similar to the student t-test. Z test is used for relatively large samples (say n>30), and the population standard deviation is known. Whereas the student t-test is for small sample size, the t-test assumes the population standard deviation is unknown.
See specific examples of the Z test here.
T-Tests
There are several kinds of T-tests. You’ll have to decide on each one. The names of each are pretty descriptive. Below, I’ve added common indicators of when to use each.
One Sample T-Test
Use the One-Sample T-Test when you want to know if your sample’s mean is different from another one – either from your imagination or a specification. Or use it when you need to test the mean of a single group against a known mean.

- Where
- x̅ is observed sample mean
- μ0 is the population mean
- s is the sample standard deviation
- n is the number of observations in the sample
The above formula is a ratio. Also, the resemblance of the t value is the signal-to-noise ratio.
Signal
The Numerator in the above formal is the signal. The Signal is also known as effect size. It is the difference between the sample mean and the null hypothesis. For example, if the sample mean is 12, and the null hypothesis is 9, the signal is 3. If the difference increases, either positively or negatively, it means the strength of the signal increases.
Noise
The Denominator in the above formal is the noise. It measures the standard error of the mean. Noise tells the accuracy of sample estimates of the population mean.
Signal to Noise ratio
The ratio of signal to noise indicates the t value. If the signal is four and the noise is 2, then the t value is 2, which means two times the size of the standard error. If you have a high signal value and low noise, then it produces larger t-values.
A one-sample t-test tests whether a population mean differs significantly from some hypothesized value. Each makes a statement about how the actual population means μ relates to some hypothesized value M.
Two sample T-Test
You guessed it! This one is for two different samples.
A two-sample t-test tests the difference between the two population means. Also, it is a common application to determine whether the means are equal.
Each makes a statement about the difference d0 between the mean of one population μ1 and the mean of another population μ2.
A neat example of a 2 sample T-test is this one about Groundhog’s Day from MiniTab.
Good questions to ask yourself are:
- How is the two-sample t-test different from a Paired T?
- When would you use a two-sample t-test and not a Paired T?
Paired Sample T-Test
The paired sample t-test, sometimes called the dependent sample t-test, is a statistical procedure used to determine whether the mean difference between two observations is zero. In a paired sample t-test, each subject or entity is measured twice, resulting in pairs of observations.
Use the Paired Sample T-test to determine whether the means of 2 sets are the same or if you must compare means from the same sample group taken at different times.
Good questions to ask yourself:
- Why not just take the average value of each set and compare them against each other?
When to use a paired t-test and one sample t-test
A paired t-test compares the mean and standard deviation of two matched groups to determine if there is a significant difference between the two groups. Whereas the One-Sample T Hypothesis Test allows you to compare the (small) population mean to some hypothesized value or one sample, mean to determine if they are significantly different.
One-Way ANOVA
The one-way analysis of variance (ANOVA) is used to determine whether there are any statistically significant differences between the means of three or more independent (unrelated) groups.
The null hypothesis for ANOVA is that the mean (average value of the dependent variable) is the same for all groups. The alternative or research hypothesis is that the average is different for all groups. The ANOVA test procedure produces an F-statistic, which calculates the p-value.
Multiple ANOVA
Note that Black Belts must have a cursory knowledge of MANOVA – Multiple Analysis of Variation. You can learn more here.
Hypothesis Tests for Variances Study Guide
What You Need to Know about the Basics of Hypothesis Testing for Variances for Your Six Sigma Certification Exam
Six Sigma Green Belts
The ASQ Six Sigma Green Belt BOK requires the following:
Tests for means, variances, and proportions
Define, compare, and contrast statistical and practical significance. (Apply)Chi square
Define and interpret chi square and use it to determine statistical significance. (Analyze)
The IASSC Six Sigma Green Belt BOK requires the following:
The Villanova Six Sigma Green Belt BOK requires the following:
Six Sigma Black Belts
The ASQ Six Sigma Black Belt BOK requires the following:
Tests for means, variances and proportions
Use and interpret the results of hypothesis tests for means, variances and proportions. (Evaluate)Goodness-of-fit (chi square) tests
Define, select and interpret the results of these tests. (Evaluate)
The IASSC Six Sigma Black Belt BOK requires the following:
3.5.8 Chi-Squared (Contingency Tables)
a. Including Tests of Equal Variance, Normality Testing and Sample Size calculation, performing tests and interpreting results.
The Villanova Six Sigma Black Belt BOK requires the following:
Test for means, variances, and proportions
Apply hypothesis tests for means, variances and proportions, and interpret the results.Goodness-of-fit tests
Define, determine applicability, and apply chi-square tests and interpret the results.
What is a Hypothesis Test for Variances?
We must first understand, ‘What in the world is a variance?’ The root of the word is variability. In other words, in a statistical sense, we’re thinking about how extensive a range of options is in a sample or population.
Consider a standard bell curve graph to get a graphical sense of this. The longer it is–meaning the further it stretches across the y-axis, the more variability it has. “Spread” is another word that refers to variance – as in how far the range of possible values in a given group “spread” across.
Another way to think about Variance questions is to automatically replace the word ” Variance ” with ” Standard Deviation. “
To learn more about variance, see this article.
When do you use Hypothesis Tests for Variances?
You use these kinds of tests to know if the variability of the possible values is equal amongst two groups.
Ex. Does the new process have greater/lesser/equal variability than the old process?
What is Needed to Run Hypothesis Tests for Variances?
We generally need:
- Two groups to test against each other.
- The populations that the two groups were selected from are normally distributed.
How to do a Hypothesis Test for Variance
There are generally two types of Hypothesis Tests for Variance: Chi-Square-tests and F-tests for variance or standard deviation; both require that the original population be normally distributed.
Step 1: Pick a Variance Test
This is straightforward. When you want to see if the variance of two populations is equal, use the f-test.
If you are comparing the variance of a threshold, then pick a Chi-Square test.
Notes on the F-test
Pick when trying to determine “Are the variances of two populations equal?”
The null hypothesis of an F-test is that the two populations are equal variance (to each other).
Also, see more about f-tests here.
Notes on the Chi-Square test for variance
Use the Chi-Square to determine if the variance is equal to a specific value.
The chi-square test can be used to answer the following questions:
- Is the variance equal to some pre-determined threshold value?
- Is the variance greater than some pre-determined threshold value?
- Is the variance less than some pre-determined threshold value?
See more about Chi-Squared Hypothesis tests for Variance here.
Hypothesis Tests for Proportions Study Guide
What You Need to Know about the Basics of Hypothesis Testing for Proportions for Your Six Sigma Certification Exam
Six Sigma Green Belts
The ASQ Six Sigma Green Belt BOK requires the following:
Tests for means, variances, and proportions
Define, compare, and contrast statistical and practical significance. (Apply)
The IASSC Six Sigma Green Belt BOK requires the following:
One Way ANOVA
a. Includes Tests of Equal Variance, Normality Testing, and Sample Size calculation, performing tests, and interpreting results.
The Villanova Six Sigma Green Belt BOK requires the following:
Six Sigma Black Belts
The ASQ Six Sigma Black Belt BOK requires the following:
Tests for means, variances and proportions
Use and interpret the results of hypothesis tests for means, variances and proportions. (Evaluate)Analysis of variance (ANOVA)
Select, calculate and interpret the results of ANOVAs. (Evaluate)The IASSC Six Sigma Black Belt BOK requires:
3.5.7 One and Two Sample Proportion
One Way ANOVA
a. Including Tests of Equal Variance, Normality Testing and Sample Size calculation, performing tests and interpreting results.
The Villanova Six Sigma Black Belt BOK requires the following:
Test for means, variances, and proportions
Apply hypothesis tests for means, variances and proportions, and interpret the results.Analysis of Variance (ANOVA)
Define, determine applicability, and apply ANOVAs and interpret the results.
What is a Hypothesis Test for Proportions?
A hypothesis test for proportion is a way to see if there is a difference between two groups. In other words, between a group and a given standard.
When do you use Hypothesis Tests for Proportions?
You would use a Hypothesis test for proportion when you’re asked about the difference between two variables.
What is Needed to Run a Hypothesis Test for Proportions?
- Simple, random sampling
- Just (2) possible outcomes.
- Label 1 outcome a success, the other a failure.
- Have at least 10 successes and 10 failures
- Finally, the population is 20 times as large as the sample size.
How to do a Hypothesis Test for Proportions
Step 1: Write the Hypothesis and decide which type of tailed test you need.
We’ve covered hypothesis writing earlier. It’s very easy when writing Proportion tests.
Just remember that the null hypothesis ALWAYS includes some kind of equals. (Ex =, <=, or >=)
Furthermore, an alternative hypothesis is a statement that there is a relationship between two variables, a difference between two groups, or a difference from a previous or existing standard.
Let’s move on to the kind of tailed test.
One tail
If you want to reject if something is too small or too big, you’re doing a one-tail test.
But which tail?
Left tail vs. Right tail
Left tail: alternative hypothesis expresses ‘less than.’
Right tail: alternative hypothesis expresses “greater than”
Two tail
For example, If the alternative hypothesis has l=
Step 2: Compute the Standard Deviation (of the sample!)
σ = sqrt[ P *(1 – P)/n]
where P is the hypothesized value of population proportion in the null hypothesis, and n is the sample size.
Step 3: Compute the test statistic
The test statistic is a z-score (z) defined by the following equation.
z = (p – P)/σ
where P is the hypothesized value of population proportion in the null hypothesis, p is the sample proportion, and σ is the standard deviation of the sampling distribution.
Step 4: Find the P value
The P-value is the probability of observing a sample statistic as extreme as the test statistic. Since the test statistic is a z-score, use that process to assess the probability associated with the z-score.
Step 5: Interpret your results
Given the null hypothesis, the researcher rejects the null hypothesis if the sample findings are unlikely. Typically, this involves comparing the P-value to the significance level and rejecting the null hypothesis when the P-value is less than the significance level.
Hypothesis Tests Master Index
Helpful Links:
Statistics References
IASSC Equation Guide
Distribution Test Hubs
Hypothesis Tests Listing
- Means Test
- One Sample
- Two Samples
- Paired t (test 2 tail, left, right)
- Two Sample Z Tests
- Equal Variance
- 2 Mean, Equal Variance (discuss pooled s) z (test 2 tail, left, right)
- Unequal Variance
- 2 Mean, Unequal Variance z (test 2 tail, left, right)
- Equal Variance
- Two Sample T-Tests
- Equal Variance
- 2 Mean, Equal Variance (discuss pooled s) z (test 2 tail, left, right)
- Unequal Variance
- 2 Mean, Unequal Variance z (test 2 tail, left, right)
- Equal Variance
- Variance Tests
- Continuous Data
- Population
- Chi-Square Hypothesis Tests
- The Chi-Square Test (Variance, not Proportions)
- Chi-Square Test of Independence (Comparing observations)
- Chi-Square Hypothesis Tests
- Samples
- Population
- Continuous Data
- Proportion Tests
- Discrete Data
- BinomialP-Test
- Continuous Data
- Other
- Observational Frequency
- Chi-Square Test of Proportion
- Observational Frequency
- Discrete Data
- Goodness of Fit (all using Chi-Square)
- Normal Goodness of Fit
- Poisson Goodness of Fit
- Binomial Goodness of Fit
- Uniform Goodness of Fit
- Confidence Intervals
- Confidence Interval for Variation
- Chi-Square
- Confidence Interval for
- Means
- Proportion
- Proportion (Interval for two Proportions)
- p test using Z
- Confidence Interval for Variation
Additional Helpful Hypothesis Testing Study Guide Videos
Introduction to Hypothesis Testing
How to Choose Which Hypothesis Test to Use
Beyond Normal: Non-Parametric Hypothesis Tests
Finally, Black belt candidates are widely expected to be conversant in non-parametric hypothesis testing across all three types; Means, Variance, and Proportion.
Here are the specific requirements for each:
Six Sigma Green Belts
Also see, IASSC Six Sigma Green Belt BOK requires:
3.5 Hypothesis Testing with Non-Normal Data
3.5.1 Mann-Whitney
3.5.2 Kruskal-Wallis
3.5.3 Mood’s Median
3.5.4 Friedman
3.5.5 1 Sample Sign
3.5.6 1 Sample Wilcoxon
Six Sigma Black Belts
The ASQ Six Sigma Black Belt BOK requires:
Also see Non-parametric tests
Select, develop and use various non-parametric tests, including Mood’s Median, Levene’s test, Kruskal-Wallis, and also Mann-Whitney, etc. (Evaluate)
The IASSC Six Sigma Black Belt BOK requires:
Hypothesis Testing with Non-Normal Data
3.5.1 Mann-Whitney
3.5.2 Kruskal-Wallis
3.5.3 Mood’s Median
3.5.4 Friedman
3.5.5 1 Sample Sign
3.5.6 1 Sample Wilcoxon
When you’re ready, there are a few ways I can help:
First, join 30,000+ other Six Sigma professionals by subscribing to my email newsletter. A short read every Monday to start your work week off correctly. Always free.
—
If you’re looking to pass your Six Sigma Green Belt or Black Belt exams, I’d recommend starting with my affordable study guide:
1)→ 🟢Pass Your Six Sigma Green Belt
2)→ ⚫Pass Your Six Sigma Black Belt
You’ve spent so much effort learning Lean Six Sigma. Why leave passing your certification exam up to chance? This comprehensive study guide offers 1,000+ exam-like questions for Green Belts (2,000+ for Black Belts) with full answer walkthroughs, access to instructors, detailed study material, and more.

Comments (23)
Where can I find the hypothesis testing cheat sheet? When I tested I scoured the Internet for one and just couldn’t find one I liked, so I developed my own although it wasn’t pretty. I’d love to see what you came up with.
I’ll be posting it shortly, Jennifer. Just sent to a graphic designer to pretty it up for me (and make it legible for everyone!) If you’re on the newsletter mailing list, you’ll be the first to know when I post it!
Jennifer, I have uploaded the hypothesis testing cheat sheet to the free member’s area here.
You can create an account here. Once authenticated you’ll have access. Hope this helps! Enjoy!
Ted: How do I find the Hypothesis Testing Cheat Sheet? It does not come up in a search.
Just create a membership here and it’s available in the member’s section.
Hi,
Thank you for all these excellent resources 🙂
I’ve tried to acces the cheatsheet while logged in but the webpage says “Sorry, but you’re not allowed to access this course”.
Could you please help me? Thank you in advance.
Best regards,
David
David, just create a free account and look for the ‘free resources’ section in the member area.
Also, Jennifer, since you have a Paid Green Belt membership, you can just logon and go to the Free Resources link in Module one here.
In the quizzes, there are many problems that use standard error and margin of error. Some problems explicitly state to solve for standard error and margin of error while other clearly state standard error is X and margin of error is Y. This is helpful because it directs me to the correct equation to use. However, there are some problems that state the error is X.X or Y%. In these situations, how do I know if the problem is referring to this valve as the standard error or margin of error? One example of this is your quiz questions about Alzheimer’s disease and the XYZ Brewing Company. Do you have any guidance for this? Thanks
Hi Chris,
Let’s move this to the paid member’s forum. Being able to give thoughtful and complete answers there is one of the chief benefits of the paid membership.
Best, Ted.
Thank you for the information however request you to incorporate all the tests of hypothesis with simple examples used in day to day life.Also catagorize with the type of hypothesis it falls under for eg simple,complex ,empirical… if possible
Hi Swati,
Glad you like the information. What other hypothesis tests would you add? Also, if you click the link to the ones listed you’ll go to a page where you’ll see more information and examples.
I’m not sure what you mean about type of hypothesis. Could you elaborate?
Best, Ted.
What are the two distinct types of hypothesis?
Hi,
Examples for each test would be appreciated.
Thanks
Hi Shubham – I have hundreds of examples in the paid course. Come join us!
Hi!would you mind if u also gives idea like ths about other statistical tools in parametric and its the same tools in non-parametric for comparison po.tnx in advance. I do have a xerox of some statistical tool but its already faded .and i cant find a book with that kind of discussion..
Hi Vega,
Thanks for the note. You can see this in the nonparametrics article and the other articles linked from there.
Best, Ted
Hi,
My data set is of 1000 samples collected by using questionnaire. Questionnaire consists of 3 parts in it 1st one is of Demographical Details of the respondents 2nd is About Branding and Buying behaviour of consumer ( Categorical Data)
3rd part is of Likert scale data .
My Dependent variable is Consumer Behaviour and independent Variable is Likrt scale , could you please suggest me which test is appropriate for my study
What question are you trying to answer with these data?
Thanks for the information, but my interest is on incentives and employee performance ;
Ho: there is no significant relationship between incentives and employee performance
H1: there is a significant relationship between incentives and employee performance
Which test of hypothesis should I use under the above context
That depends on the kind of data you have, Michael, and how you want to test it.
Here’s my guide to Hypothesis tests that may help you select the right test once you know the answer to the above.
Under the explanation of the Z-Test (above) it states “Use a Z test when you DON’T know the mean and Standard Deviation of the population.”
I’ve seen a few other sources that qualify use of the Z-Test by making sure you DO know the Standard Deviation of the population.
Specifically, a couple of ‘Decision Trees’ related picking the right Hypothesis Test.
This first one explicitly says use the Z-Test when the population standard deviation is known:
https://bloomingtontutors.com/blog/when-to-use-the-z-test-versus-t-test
And this one allows for 2 Z-Test choices depending on whether you know the population standard deviation or the sample standard deviation:
https://nititek.wordpress.com/2013/11/27/t-test/
Can you confirm the statement above (i.e. Use a Z test when you DON’T know the mean and Standard Deviation of the population.) is correct?
By the way, it would be awesome to see a SixSigmaStudyGuide version of a Decision Tree to guide Hypothesis Testing … even if it was a link to such a tree on another site that you felt was accurate.
Thanks!
Thank you Rick Stuckey for the feedback. We have updated the article and also included the decision tree we already have it on the below article.
https://sixsigmastudyguide.com/two-sample-z-hypothesis-tests/