Single sample test of a given proportion is used to estimate the proportion of the population. For example, to estimate the proportion of Spanish-speaking students in a school is lower than the state proportion. Basically, it is used to compare the proportion to a target or reference value.
Furthermore, the proportion test is to determine the percentage of individuals who have a particular characteristic. It also calculates a range that is likely to include the population proportion. Hence, proportion involves a binomial distribution.
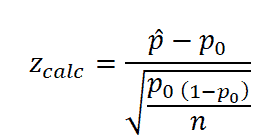
Single sample test of a given proportion Formula

Where
- Z is test statistic
- p̂ is the sample or observed proportion
- P0 hypothesized proportion
- n sample size
When to use
We use the Single sample test of a given proportion when both the independent (X) and dependent variables are discrete. Hence it follows a binomial distribution.
Assumptions of Single sample test of a given proportion test
- Population follows a binomial distribution.
- Sample is unbiased and representative
- Both main and variance np0, n(1- p0) for binomial distribution are both ≥5, then the sampling distribution can be approximated by the normal distribution.
Hypothesis of Single sample test of a given proportion
- Null hypothesis H0: population proportion is equal to hypothesized proportion, in other words, p=p0
- Alternative hypothesis H1: population proportion is not equal to hypothesized proportion p≠p0 (Two-tailed)
- H1: Population proportion is less than hypothesized proportion p<p0 (One-tailed)
- H1: Population proportion is greater than hypothesized proportion p>p0 (One-tailed)
How to calculate Single sample test of a given proportion
- First, estimate the proportion p, as p̂ =x/n
- Where x is the sample who have same characteristic, n is the sample size
- Select appropriate statistic- one-tailed or two-tailed?
- State the null hypothesis and alternative hypothesis
- State alpha, in other words determine the significance level
- Define the rejection criteria
- Check the assumption, both np0, and n(1- p0)≥5
- Compute the test statistic,
- Determine z critical value
- Finally, interpret the result. If the test statistic falls in critical region, then reject the null hypothesis.
Example of Single sample test of a given proportion
Right-Tailed
Example: A property leasing office is conducting a vaccination drive, and they are encouraging more women to participate in the event. While a sample of 4300 vaccination reports, it is indicated that 2200 are women. Property manager is confident that at least 49 percent of women participated in the drive. At α=0.05, were their vaccination drive efforts successful?
- P0=0.49
- x=2200
- n=4300
- p̂=x/n=2200/4300=0.512
Define Null and Alternative hypothesis
- Null Hypothesis: population proportion is equal to hypothesized proportion p= 0.49
- Alternative Hypothesis: population proportion is greater than hypothesized proportion p>0.49
State Alpha
- α=0.05
Both np0, and n(1- p0)≥5
Calculate test statistic
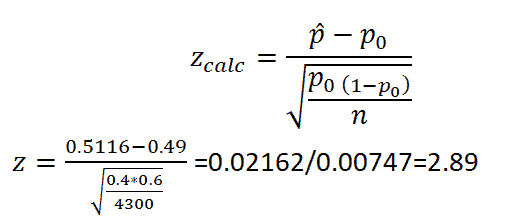
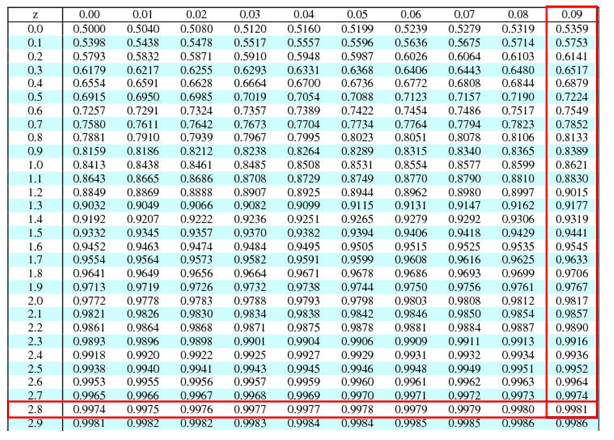
Since, we are looking for longer, P(Z>2.89) = 1- P(Z<2.89)= 1-0.9981 = 0.0019
Since p value (0.0019) is less than the alpha value (0.05), we have enough evidence to reject the null hypothesis which makes our test significant. Therefore vaccination drive is successful
