Two Sample Z Hypothesis Tests is a parametric test is to compare the means of two independent groups of samples drawn from a normal population. In other words, it is the test to know the means of two populations are the same or different. For example, the mean salaries of male workers are greater than the female workers for the same job?
When to use Two sample Z hypothesis tests
Two sample Z test compares the means of samples of independent groups taken from a normal population. Also, in this test you will have only two groups with independent samples. To compare three groups, use One Way ANOVA instead of Z test.
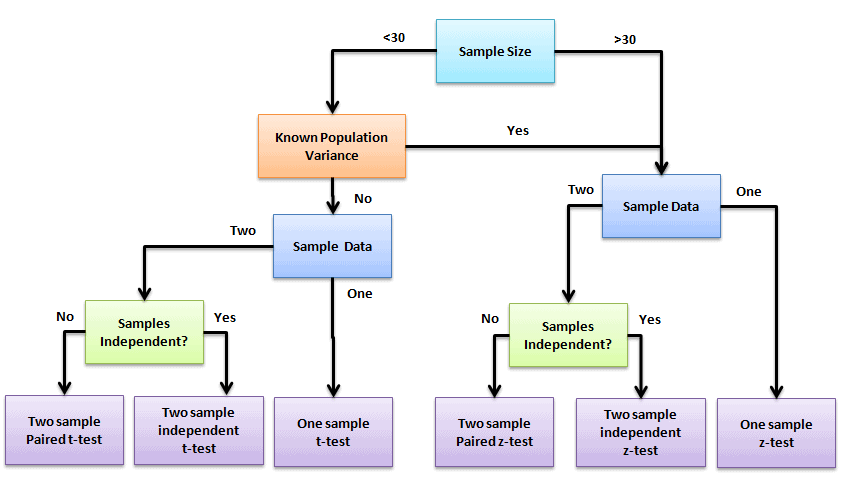
Furthermore, Z test is similar to the student t-test. Z test is basically used for relatively large samples (say n>30) and the population standard deviation is known. Whereas, student t-test is for small sample size, and also t-test assumes the population standard deviation is unknown.
Difference between One and Two sample Z hypothesis test
The two-sample z test is to tests the difference between means of two groups, whereas a one-sample z test is to tests the difference between a single group and the hypothesized population value.
Assumptions of Two sample Z hypothesis tests
- Population data is continuous
- Population follows a standard normal distribution
- Both sample ends must be higher than 30
- The population standard deviation is known
- Similar spread between the groups, in other words homogeneity of variance
- Both the samples should be randomly selected from the population
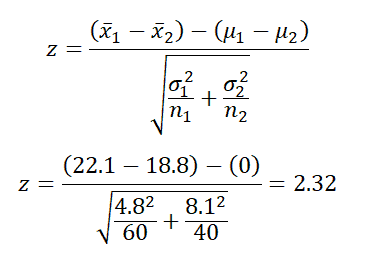
Two sample Z-test Formula
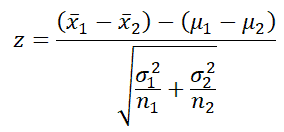
- x̅1 = sample mean of first sample
- x̅2 = sample mean of second sample
- µ1= Mean of first population
- µ2= Mean of second population
- σ12= population variance in first population
- σ22= population variance in second population
- n1= sample size of first group
- n2= sample size of second group
Hypothesis Testing
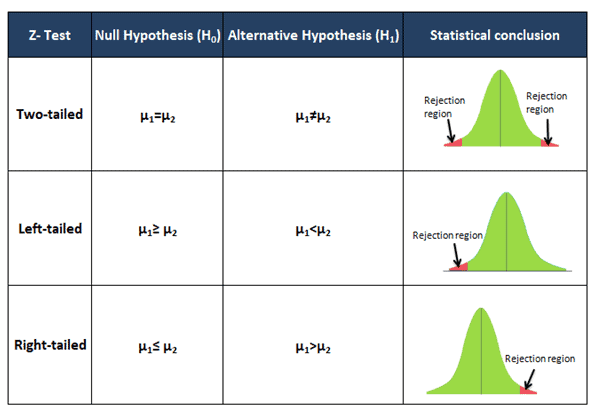
A tailed hypothesis is an assumption about a population parameter. The assumption may or may not be true. A one-tailed hypothesis is a test of hypothesis where the area of rejection is only in one direction. Whereas two-tailed, the area of rejection is in two directions. The selection of one or two-tailed tests depends upon the problem.
Two Sample z test mostly performed in Analyze phase of DMAIC to check two sample means are significantly different when the population’s standard deviation is known.
Steps to Calculate Two Sample Z hypothesis test
- Select appropriate statistic- one-tailed or two-tailed?
- Determine the null hypothesis and alternative hypothesis
- Determine the level of significance
- Find the critical value
- Calculate the standardized test statistics
- Then make a decision to reject or fail to reject the null hypothesis. Reject the null hypothesis, If the test statistic falls in the critical region.
- Finally, interpret the decision in the context of the original claim.
Example of Right-tailed test
Example: Princeton school science teacher claims that students in his section will score higher marks than those in his colleague’s section. The mean science score for 60 students in his section is 22.1, and the standard deviation is 4.8. The mean science score for 40 of the colleagues’ sections is 18.8, and the standard deviation is 8.1. At α = 0.05, can the teacher’s claim be supported?
- State the null and alternative hypothesis
- Null hypothesis H0: µ1 ≤ µ2
- Alternative hypothesis H1 : µ1 > µ2
- Select appropriate statistic- Since the claim is student scores higher marks than the colleagues section; it is a right-tailed test.
- Level of significance: α= 0.05
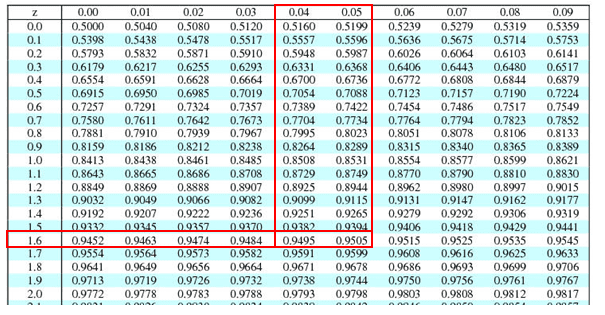
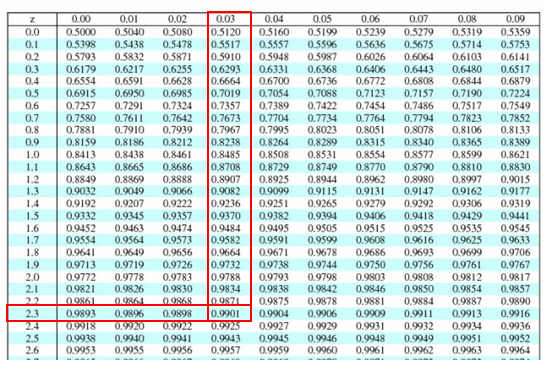
- Find the critical value: 1-α= 1-0.05=0.95
- Look at the 0.95 in z table= 1.645
- Calculate the test statistics
- x̅1 = 22.1
- x̅2 = 18.8
- σ1= 4.8
- σ2= 8.1
- n1= 60
- n2= 40
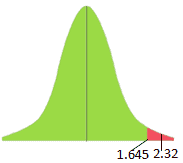
Interpret the results: Compare Z calc to Z critical . In hypothesis testing, a critical value is a point on the test distribution compares to the test statistic to determine whether to reject the null hypothesis. zcal value is in the rejection region. Hence, we have enough evidence to reject the null hypothesis. So, at 5%, we have enough evidence to support the teacher’s claim that his students score higher than his colleague students.
Example of left-tailed test
Example: A dietician claims that participants in the X program yield less weight reduction than the Y program. The mean weight reduction for 100 participants in the X program is 19.7lb, and the standard deviation is 6.2. Similarly, for program Y, for 120 participants, it is 21.2lb, and the standard deviation is 7.6. At 1% level of significance, can you support the dietician claim?
- State the null and alternative hypothesis
- Null hypothesis H0: µ1 ≥ µ2
- Alternative hypothesis H1 : µ1 < µ2
- Select appropriate statistic- Since the claim is participants in X program yields less weight reduction than Y program; it is a left-tailed test.
- Level of significance: α= 0.01
- Find the critical value: 1-α= 1-0.01=0.99
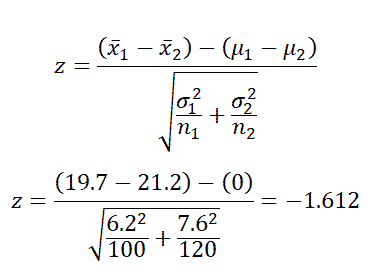
- Look at the 0.99 in z table= 2.330
- Calculate the test statistics
- x̅1 = 19.7
- x̅2 = 21.2
- σ1= 6.2
- σ2= 7.6
- n1= 100
- n2= 120
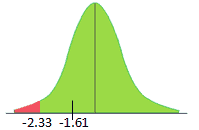
Interpret the results: Compare Z calc to Z critical . In hypothesis testing, a critical value is a point on the test distribution compares to the test statistic to determine whether to reject the null hypothesis. zcal value is not in the rejection region. Hence, we failed to reject the null hypothesis. So, at 1% we don’t have enough evidence to support the dietician’s claim.
Example of Two-tailed test
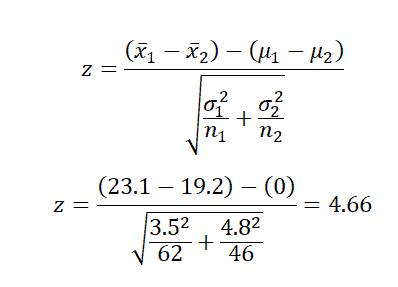
Example: Glenbrook sports center is planning to compare the ages from a random sample of male and female swimmers in their coaching center. The swimming coordinator collected 62 female swimmers’ data, and the mean age is 23.1 with a standard deviation of 3.5. Similarly, collected 46 male swimmers data and the mean average is 19.2 with a standard deviation of 4.8. Assume the population follows a standard normal distribution. At 5% significance level, test whether there is a significant difference in age between the sexes?
- State the null and alternative hypothesis
- Null hypothesis H0: µ1 = µ2
- Alternative hypothesis H1 : µ1 ≠ µ2
- Select appropriate statistic- Since the Glenbrook sports center planning to test whether there is a significant difference in age between the sexes ; it is a two-tailed test.
- Level of significance: α= 0.05
- Since it is a two tailed test α/2= 0.05/2=0.025
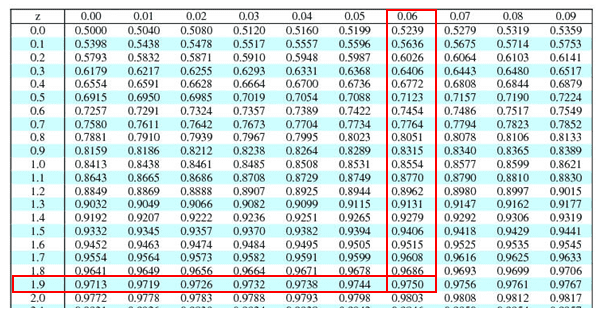
- Find the critical value: 1-α/2= 1-0.025=0.975
- Then, look at the 0.975 in z table= ±1.96
- Calculate the test statistics
- x̅1 = 23.1
- x̅2 = 19.2
- σ1= 3.5
- σ2= 4.8
- n1= 62
- n2= 46
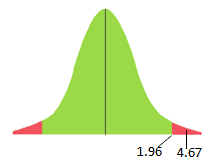
Interpret the results: Compare Z calc to Z critical . In hypothesis testing, a critical value is a point on the test distribution compares to the test statistic to determine whether to reject the null hypothesis. zcal value is in the rejection region. Hence, we have enough evidence to reject the null hypothesis. So, at 5% we have enough evidence to support the significant difference in age between the sexes.
Helpful Videos
https://www.youtube.com/watch?v=5NcMFlrnYp8

Comments (11)
How is that in the Kaito’s tomato problems, you can use t statistic ?
Here , the standard deviation is known. One of the assumption for t statistic is that the standard deviation must be unknown.
Hello Rahul,
A t-test is used to compare the mean of two given samples. Like a z-test, a t-test also assumes a normal distribution of the sample. A t-test is used when the population parameters (mean and standard deviation) are not known.
In the example, we have sample standard deviations, not the population standard deviation.
Thanks
i have examples of two sample – when variance is the same, but there is no information how i conduct a test when variances are different, so the question is :
1. where i can find examples when variance is not the same , not equal ? for two unpaired groups ?
2. Where i can find the examples for two sample Z test for paired groups ?, because i can not find as well that ?
Hello Damian Koziol,
To compare variance, you can use the F-Test, and if you are an existing member of our site, you can find various examples of paired groups with detailed explanations.
Thanks
If I know the two-group Z test statistic value, can I calculate the Cohen’s effect size from it..?
Hi Vineeth,
I’m not very familiar with Cohen’s effect size. Can you tell me which formula your using and the context?
Hi Veneeth,
If you know two groups’ mean value and pooled standard deviation you can compute the effect size.
Cohen’s d is an appropriate effect size for the comparison between two means.
It takes the difference between two means and expresses it in standard deviation units. It tells you how many standard deviations lie between the two means.
The effect size is the mean difference between two groups, subtract the mean of one group from the other (M1 – M2) and divide the result by the standard deviation (SD)
d = (M1- M2)/s
Cohen suggested that d = 0.2 be considered a ‘small’ effect size, 0.5 represents a ‘medium’ effect size and 0.8 a ‘large’ effect size. This means that if the difference between two groups’ means is less than 0.2 standard deviations, the difference is negligible, even if it is statistically significant.
Thanks
I think in the Z test also the author of this article used sample standard deviations instead of population standard deviations mistakenly.
Please correct me if i am wrong.
Hello Sujith,
For large samples (say >30), the sample variance and the population variation are pretty much the same (equivalent for n→∞), and even for n=30 they shouldn’t give you something too different.
The t-tests assume the standard deviation is unknown, while z-tests assume it is known. However, If the standard deviation of the population is unknown, the assumption of the sample variance equaling the population variance is made.
Thanks
Hello team,
I’ve seen 2 equations solving for Equal Variances using T tests. How do we determine when to use pooled variance vs pooled standard deviation?
Hello Paco Garcia,
The pooled variance is used when the variances of the two populations being compared are assumed to be equal. Whereas the pooled standard deviation is used when the variances of the two populations being compared are assumed to be equal, and the sample sizes are small.
In short, pooled variance is used when the variances of the two populations being compared are assumed to be equal, and the sample sizes are large enough to assume a normal distribution. Pooled standard deviation is used when the variances of the two populations being compared are assumed to be equal, and the sample sizes are small.
Thanks