The one and two-sample proportion hypothesis tests involve one factor with one and two samples, and likewise, these tests may assume a binomial distribution. If more than two samples exist then use the Chi-Square test.
One Sample Z Proportion Hypothesis Test
The One Sample Proportion Test is used to estimate the proportion of a population. It compares the proportion to a target or reference value and also calculates a range of values that is likely to include the population proportion. This is also called the hypothesis of inequality.
Furthermore, use normal approximation or binomial enumeration based on the sample size. If the sample size is large, then normal approximation will give more accurate results. If the sample size is less then binomial enumeration gives much more accurate results.
Assumptions of the one sample Z Proportion test
- Firstly, the data are simply random values from the population
- Secondly, the population follows a binomial distribution
- When both mean (np) and variance( n(1-p)) values are greater than 10, the binomial distribution can be approximated by the normal distribution
Hypothesis of one sample Z proportion test
- Null hypothesis: population proportion is equal to the hypothesized proportion
- Alternative hypothesis: population proportion is not equal to or different from the hypothesized proportion (two-tailed)
- Population proportion is greater than the hypothesized proportion (one-tailed)
- Population proportion is less than the hypothesized proportion (one-tailed)
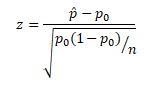
Test statistic for one sample Z proportions test

Where
- z is the test statistic
- p̂is observed proportion
- P0 is the hypothesized probability
- n is the sample size
Procedure to execute One Sample Z Proportion Hypothesis Test
- Firstly, state the null hypothesis and alternative hypothesis
- State alpha, in other words, determines the significance level
- Thirdly, compute the test statistic
- Fourthly, determine the critical value (from the critical value table)
- Then, define the rejection criteria
- Finally, interpret the result. In the event that the test statistic falls in the critical region, reject the null hypothesis
Example of One Sample Z Proportion Test
A researcher claims that Republican Party will win in the next Senate elections, especially in Florida State. Statistical data reported that 23% voted for Republican Party in the last election. To test the claim a researcher surveyed 80 people and found 22 said they voted for Republican Party in the last election. Is there enough evidence at α=0.05 to support this claim?
- P0=0.23
- n=80
- p̂=22/80=0.275
Then, define the Null and Alternative hypothesis
- Null Hypothesis: p= 0.23
- Alternative Hypothesis: p≠0.23
State Alpha
- α=0.05
State decision rule
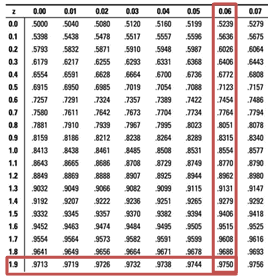
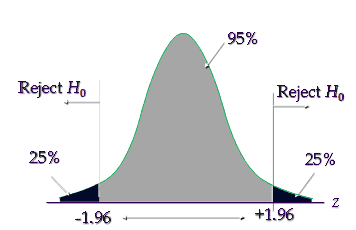
The critical value is ±1.96, hence reject the null hypothesis if the calculated value is less than -1.96 or greater than +1.96
Then, calculate the test statistic
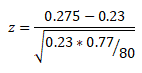
= 0.045 / 0.047 = 0.957
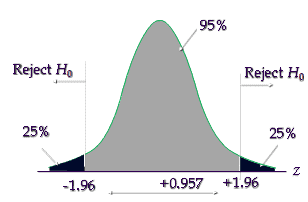
Since the calculated value is between -1.96 and 1.96 and it is not in the critical region, hence failed to reject the null hypothesis.
Six Sigma Black Belt Certification One Sample Proportion Z Test Questions:
Question: Which of the following statement is true, the right-tailed test of a single sample proportion test statistic value is +1.12 and the critical value from the table is +2.89.
(A) Reject the null hypothesis
(B) Failed to reject the null hypothesis
(C) Accept the null alternative hypothesis
(D) None of the above
Answer:
B: The statistic value is less than the critical value and not in the critical region, hence failed to reject the null hypothesis.

Comments (4)
Good Day Ted,
When I solve this two sample test of proportions using the formula below from IASSC Reference Document, I get 2.26. Can you please advise if there’s a step I’m missing; or could this just be a difference resulting from rounding throughout solving?
P1-P2/ square root of P1(1 – P1)/n1 + P2(1- P2)/n2
Hi Lemarcus,
A few things:
1) I’ve moved the 2 Sample text and example to it’s own page here.
2) There are (2) versions of the 2 Sample Proportions test; a pooled version and the unpooled version. The IASSC equation sheet makes use of the unpooled equation while the ASQ, Villanova, and most other certifying bodies make use of the pooled version. The question you’re asking about is using the pooled version, hence why the equations are different.
I’ve added a bit more on the difference between pooled and unpooled here.
I’ll also update the article to have a walkthrough for both pooled and unpooled.
Best, Ted.
Hello, this is wrong: “When both mean (np) and variance( n(1-p)) values are greater than 10, the binomial distribution can be approximated by the normal distribution”
Variance in np(1-p), and n(1-p) is the number of failures. This is the Normal Condition to ensure at least 10 successes and 10 failures.
Hello Daniel,
The statement is correct only.
To apply the normal approximation to a binomial distribution, ensure both the expected number of successes (np) and expected number of failures (n(1-p)) are at least 10. This condition ensures that the binomial distribution approximates a normal distribution when success and failure counts are sufficiently large.
When both the mean (np) and variance (n * p * (1 – p)) of the binomial distribution are relatively large (usually over 10), the approximation is justified by the Central Limit Theorem, which states that large samples from any population tend to have a normal distribution for their sample means.
Thanks