1 sample Wilcoxon non parametric hypothesis test is one of the popular non-parametric tests. One sample t-test is to compares the mean of the population to the known value (i.e more than, less than, or equal to a specific known value). The t-test always assumes that random data and the population standard deviation is unknown.
Wilcoxon Signed-Rank test is the equivalent non-parametric t-test, and this may be used when the dependent variable is not normally distributed. The Wilcoxon signed test is designed to test hypotheses about the location (median) of a population distribution.
History
The Wilcoxon signed test was first developed by Frank Wilcoxon, an American chemist in the year 1945, but popularized by Sidney Siegel in 1956. Wilcoxon Signed test can be used for a single sample, matched paired data (example before and after data), and also for unrelated samples ( it is almost similar to Mann Whitney U test).
Disambiguation
1 sample Wilcoxon non parametric hypothesis test is a rank-based test and it compares the standard value (theoretical value) with the hypothesized median. Usually, the t-test depends on the sample mean which is not so stable in heavy-tailed distribution; hence Wilcoxon test efficiency is high when compared to the t-test.
The name Sign test and Wilcoxon signed ranked test look similar and both are used for one sample & two samples, but Wilcoxon signed rank test is more powerful than the signed test.
Wilcoxon Signed-Rank Test for Paired Samples – This test is mainly an alternative to the t-test for paired samples i.e. if the requirements for the two paired t-tests are not satisfied then we can easily perform this test. It has three requirements all of which should be satisfied in order to perform this test. It has two methods: the exact one and the advanced one.
Hypothesis of 1 sample Wilcoxon Signed test
Left-tailed test:
- Null Hypothesis H0: The population median (η) is greater than or equal to hypothesized median(η0)- η≥ η0
- Alternative Hypothesis : H1: The population median(η) is less than the hypothesized median(η0) – η<η0
Right-tailed test:
- Null Hypothesis H0: The population median (η) is less than or equal to hypothesized median(η0)- η≤η0
- Alternative Hypothesis : H1: The population median(η) is greater than the hypothesized median(η0)- η>η0
Two-tailed test:
- Null Hypothesis H0: The population median (η) is equal to hypothesized median(η0)- η=η0
- Alternative Hypothesis : H1: The population median(η) is not equal to the hypothesized median(η0)- η≠η0
Assumptions of the one sample Wilcoxon test
- Differences between the data value and the hypothesized median are continuous
- Data follows the symmetric distribution
- Observations are mutually independent of each other
- Measurement scale is at least an interval
Procedure to execute One Sample Wilcoxon Non Parametric Hypothesis Test
- Identify the difference between each individual value and the median
- If the difference between the individual value and the median is zero, ignore it.
- Ignore the signs of the different values and assign the lowest rank to the smallest difference value. If the values have been tied, then consider the mean value.
- Compute the sum of ranks of positive difference values, and negative difference values (W+ and W-)
- If the values are (>20), the normal approximation would be
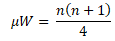
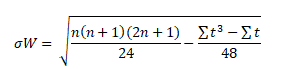
Where t is the rank of tied values
- Calculate the z-value using

- Compare the test statistic, W, with the critical value in the tables; the null hypothesis can be rejected if W is less than or equal to the critical value.
- Now, compare the test statics with critical values in the tables and make a decision, the null hypothesis will be rejected if the test statistic, W, is less than or equal to the critical value
- Interpret the decision in the context of the original claim.
Example of One Sample Wilcoxon Test
In a law college, random samples of 10 students’ marks are noted below, is there evidence at the 5% confidence level to suggest that the median mark is greater than 67?

- Null Hypothesis H0: The population median value ≤ 67 marks
- Alternative Hypothesis : H1: The population median value > 67 marks
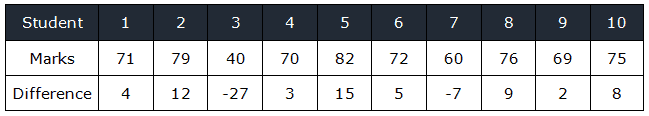
Ignoring the signs, rank the differences smallest rank =1
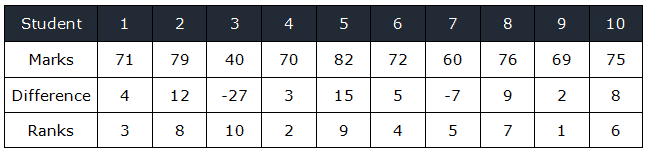
Separate the positive and negative ranks
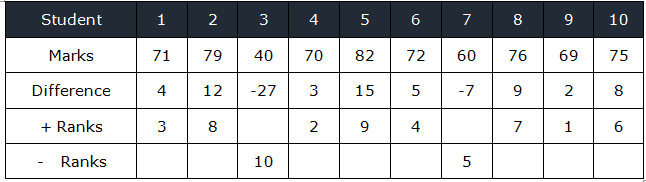
- Sum of + ranks =40
- Sum of – ranks=15
- Smallest value among 40 & 15 =15
- Test statistics =15
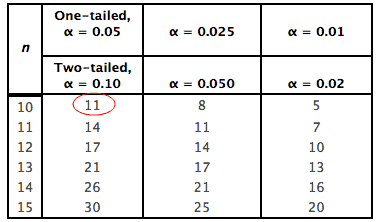
Critical value =11
The null hypothesis will be rejected if the test statistic, W, is less than or equal to the critical value.
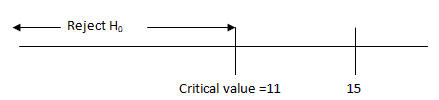
Since the test statistic value is greater than the critical value, hence we fail to reject the null hypothesis. There is no significant evidence that the median rank is greater than 67.
Additional Wilcoxon Examples and Helpful Links:
http://www.unm.edu/~marcusj/WilcoxonSR.pdf
Six Sigma Black Belt Certification 1 Sample Wilcoxon Test Questions:
Question 1: Which of the following scenario the decision will impact the Wilcoxon test?
(A) Ties the values between the samples
(B) Ties of values never impact the decision
(C) Ties values within one sample
(D) Ties the values always impact the decision
When you’re ready, there are a few ways I can help:
First, join 30,000+ other Six Sigma professionals by subscribing to my email newsletter. A short read every Monday to start your work week off correctly. Always free.
—
If you’re looking to pass your Six Sigma Green Belt or Black Belt exams, I’d recommend starting with my affordable study guide:
1)→ 🟢Pass Your Six Sigma Green Belt
2)→ ⚫Pass Your Six Sigma Black Belt
You’ve spent so much effort learning Lean Six Sigma. Why leave passing your certification exam up to chance? This comprehensive study guide offers 1,000+ exam-like questions for Green Belts (2,000+ for Black Belts) with full answer walkthroughs, access to instructors, detailed study material, and more.

Comments (16)
The example answer conflicts with results of a box plot. Can you please help explain the difference?
The observed median is 71.5: (40,60,69,70,71 ,72,75,76,79,82)
Hypothesized median is 67, with Quartile 1=69, and Quartile 3=76, this places hypothesized median BELOW Q1. A boxplot would visually argue that the median is in fact higher than the test value. Further, the observed median is 6.7% higher than the hypothetical median.
Looking at the data points you used, it appears to me that the left tail values are NOT symmetrical, which would *normally* violate the conditions for using the 1-sample Wilcoxon.
I realize this is just an example, but I REALLY want to understand this. Is my view on this correct, or am I missing something?
Help would be GREATLY appreciated! 🙂
Steven,
This is a good question. Essentially you are asking what is the explicit criteria of symmetry around the mean as it pertains to using this technique.
I love your thinking in visualizing the data / mean with box plots!
We will need to research to get you a more satisfactory answer that goes beyond the scope of what we cover (Six Sigma exams).
My initial thoughts are that obviously the data in a non-parametric example wouldn’t be totally symmetrical…. or else it would be a parametric test. And in your visualization you’re using the whole sample set provided. So then the question becomes (again), practically, what’s the exact definition of symmetry here.
We’ll have to get back to you.
You are correct Steven,
The variable of interest should leans left or right with most of the data on the edge rather than in the middle when you plot your data in a histogram, to get that one we need enough data, but for example sake we just took few samples.
For one sample wicoxon test , the variable of interest should be continuous and you should have enough data (at least more than 5 values, but often more than 200 values are required).
Thanks
Hello Ramana,
what is the distribution that we need to use when computing the critical values?
Best regards.
Hi Francesco,
Good thoughts here. Honestly, I’m not sure how the table was created.
However, if you are looking for the table to use, here are 2 options
1) http://users.stat.ufl.edu/~winner/tables/wilcox_signrank.pdf
2) https://www.oreilly.com/library/view/nonparametric-statistics-a/9781118840429/bapp02.xhtml
Best, Ted.
Hi Ted,
thanks a lot!
Very welcome, Francesco!
Hello,
May I ask the following question?
In 1 sample Wilcoxon,
“For the left-tailed test:
H1: theoretical value < The hypothesized sample median "
however, in 1 Sample Sign test,
"Left tailed test- H0:median≥ Hypothesized value k; H1: median <k"
Are they supposed to be the opposite? or something wrong with my understanding?
Thanks,
Xianghao Liu
Sorry, typo there,
I mean
“1 sample Wilcoxon Signed test
For the left-tailed test:
Alternative Hypothesis : H1: The hypothesized sample median is < the theoretical value"
this time, the hypothesized sample median (k) is smaller?
Hi Xiang,
A left-tailed test alternative hypothesis should be theoretical is (H1 < H0). I'll add this notation to the items above. Does that help? Best, Ted
Hi Ted,
Thanks for your response. That’s where the problem is,
this example shows a right tailed example
“H1: The population median value >67 marks = H0”,
however, in the end, it says:
“Since test statistic value is greater than the critical value, hence ACCEPT the null hypothesis”
I believe H0 should be rejected.
Thanks,
Xiang Liu
Hi Xiang Liu,
For right-tailed test, the null hypothesis will be rejected if the test statistic is less than or equal to the critical value.
I know the hypothesis section leads to confusion. We have updated the hypothesis section and also added a graphic in the example for better clarity.
Regards
Ramana
The link for Wilcoxon Signed-Rank Test for Paired Samples just brings you back to this page.
Updated. Thanks, April-Lynn!
For a one-sided upper-tailed alternative hypothesis, the decision rule is:
reject H0 if Test Statistic > Critical value
Here our Test Statistic(15) > Critical Value(11)
So, shouldn’t we reject the null hypothesis?
Hi Asif,
For One sample Wilcoxon signed right-tailed test, the null hypothesis will be rejected if the calculated test statistic is smaller than or equal to the critical (table) value.
Thanks