Two sample Z test of proportions is the test to determine whether the two populations differ significantly on specific characteristics. In other words, compare the proportion of two different populations that have some single characteristic. It calculates the range of values that is likely to include the difference between the population proportions.
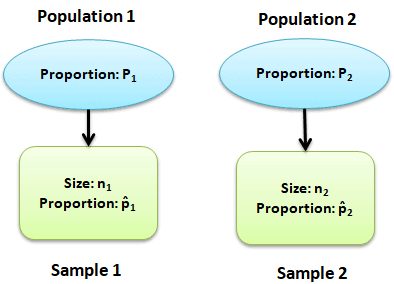
For example, compare the proportion of men baseball players who are right-handed to the proportion of women baseball players who are right-handed.
When to use Two Sample Z Proportion test
The purpose of two sample Z test is to compare the random samples of two populations. Use two sample z test of proportion for large sample size and Fisher exact probability test is an excellent non-parametric test for small sample sizes.
Assumptions of the Two Sample Z Proportion Hypothesis Tests
- The data are simple random values from both the populations
- Both populations follow a binomial distribution
- Samples are independent of each other
- Test results are accurate when np and n(1-p) are greater than 5
Hypothesis of two sample Z proportion test
- Null hypothesis: The difference between population proportions is equal to hypothesized difference
- Alternative hypothesis: The difference between population proportions is not equal to hypothesized difference (two -tailed)
- The difference between population proportions is greater than hypothesized difference (right-tailed)
- The difference between population proportions is less than hypothesized difference (left -tailed)
Two Sample Z Test of Proportions Variations
There are 2 ways to compute the two sample Z test of proportions i.e pooled or unpooled.
Pooled Z test of proportions formula
Un-pooled Z test of proportions formula
Procedure to execute Two Sample Proportion Hypothesis Test
- State the null hypothesis and alternative hypothesis
- State alpha, in other words determine the significance level
- Compute the test statistic
- Determine the critical value (from critical value table)
- Define the rejection criteria
- Finally, interpret the result. If the test statistic falls in critical region, reject the null hypothesis
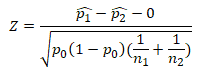
Two Sample Z Test of Proportions Pooled (ASQ, Villanova)
Where

- z is test statistic
- p̂1 and p̂2 are observed proportion of events in the two samples
- n1 and n2 are sample sizes
- X1 and X2 are number of trails
Example of Two Sample Z Proportion Test (pooled)
Example: A car manufacturer aims to improve the quality of the products by reducing the defects and also increase the customer satisfaction. Therefore, he monitors the efficiency of two assembly lines in the shop floor. In line A there are 18 defects reported out of 200 samples. While the line B shows 25 defects out of 600 cars. At α 5%, is the differences between two assembly procedures are significant?
Define Null and Alternative hypothesis
- Null Hypothesis: Two proportions are the same
- Alternative Hypothesis: Two proportions are not the same
α=0.05
State decision rule
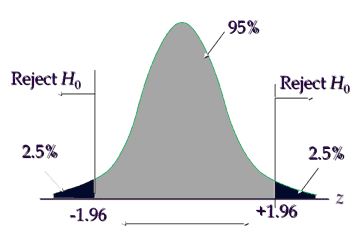
Critical value is ±1.96, hence reject the null hypothesis if the calculated value is less than -1.96 or greater than +1.96
Calculate Test Statistic
- Line A= p̂1=18/200= 0.09 = 9%
- Line B= p̂2= 25/600 = 0.0416 = 4.16%

- First compute p0 = 18+25/200+600=43/800=0.0537 =5.37%
- Now p̂1 – p̂2 = 0.09 – 0.0416 = 0.0484
- p0 * (1 – p0 ) = 0.0537 * (1-0.0537) = 0.0537 * 0.9463 = 0.0508
- And (1/n1) + (1/n2) = 0.006667
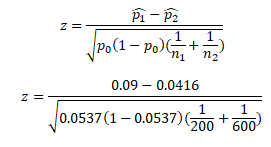
- So, Z = (0.0484)/ SQRT ( (0.0508) * (0.006667))
- Z = (0.0484)/ SQRT ( 0.000339)) = (0.0484)/ (0.018406) = 2.62
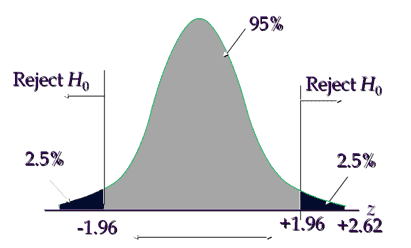
Interpret the results: Compare Zcalc to Zcritical . In hypothesis testing, a critical value is a point on the test distribution compares to the test statistic to determine whether to reject the null hypothesis. Calculated test statistic value 2.62 and it is in critical region, hence reject the null hypothesis, so, there is a significant difference in two line assembly procedures.
Pooled Z test of proportions formula template
Additional Two Sample Z Test of Proportions Pooled Helpful Links
- https://online.stat.psu.edu/stat800/lesson/5/5.5
- This tests for a difference, proportions are not the same
Two Sample Z Test of Proportions Pooled (ASQ, Villanova) Helpful Videos
https://www.youtube.com/watch?v=_58qBy9Uxks
Two Sample Z Test of Proportions Un-Pooled (IASSC)

- z is test statistic
- p̂1 and p̂2 are observed proportion of events in the two samples
- n1 and n2 are sample sizes
Example of Two Sample Z Proportion Test (Unpooled)
Example: Researchers want to test the side effects of a new COVID vaccine. In clinical trail 62 out of 300 individuals taking X1 vaccine report side effects. While 48 individuals out of 300 taking X2 vaccine report side effects. At 95% confidence level, is the X1 vaccine working any differently than the X2?
Define Null and Alternative hypothesis
- Null Hypothesis: Two proportions are the same
- Alternative Hypothesis: Two proportions are not the same
α=0.05
State decision rule

Critical value is ±1.96, hence reject the null hypothesis if the calculated value is less than -1.96 or greater than +1.96
Calculate Test Statistic
- Vaccine X1= p̂1=62/300= 0.21
- Vaccine X2 =p̂2= 48/300 = 0.16
- n1 and n2=300

- Now p̂1 – p̂2 = 0.21 – 0.016 = 0.47
- p̂1 (1- p̂1)/n1 = (0.21*(1-0.21)) /300 = 0.000547
- And p̂2 (1- p̂2)/n2 = (0.21*(1-0.21)) /300 = 0.000448
- Sqrt( (p̂1 (1- p̂1)/n1)+ (p̂2 (1- p̂2)/n2)))= 0.0315
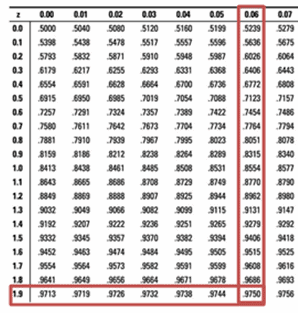
- So Z = 0.47/0.0315 = 1.48
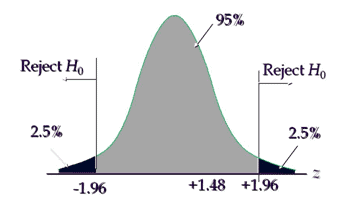
Interpret the results: Compare Zcalc to Zcritical . In hypothesis testing, a critical value is a point on the test distribution compares to the test statistic to determine whether to reject the null hypothesis. Calculated test statistic value 1.48 and it is not in critical region, hence we failed to reject the null hypothesis, and so, the two vaccine proportions are the same.
Unpooled Z test of proportions formula template
Six Sigma Black Belt Certification Two Sample Proportion Z Test Questions:
Question: What could be the null hypothesis for a two sample proportion test, if the alternative hypothesis is p1 <p2?
(A) Null hypothesis : p1 > p2
(B) Null hypothesis : p1 = p2
(C) Null hypothesis : p1 < p2
(D) Null hypothesis : p1 ≠ p2
Answer:
When you’re ready, there are a few ways I can help:
First, join 30,000+ other Six Sigma professionals by subscribing to my email newsletter. A short read every Monday to start your work week off correctly. Always free.
—
If you’re looking to pass your Six Sigma Green Belt or Black Belt exams, I’d recommend starting with my affordable study guide:
1)→ 🟢Pass Your Six Sigma Green Belt
2)→ ⚫Pass Your Six Sigma Black Belt
You’ve spent so much effort learning Lean Six Sigma. Why leave passing your certification exam up to chance? This comprehensive study guide offers 1,000+ exam-like questions for Green Belts (2,000+ for Black Belts) with full answer walkthroughs, access to instructors, detailed study material, and more.
