

Analysis of Variance (ANOVA) is a parametric statistical technique used to compare data sets. This technique was invented by R.A. Fisher; hence, it is also referred to as Fisher’s ANOVA. It is similar to techniques such as t-test and z-test to compare means and also the relative variance between them.
Similarly, a t-test can be used to compare two sample means. What if we want to compare more than two means? Analysis of variance (ANOVA) is best applied where more than 2 populations or samples are meant to be compared.
It is used to test the statistical significance of the relationship between a dependent variable (“Y”) and single or multiple independent variables (“X’s”).
Types of ANOVA
- One-way
- Measures single factor from multiple sources
- Uses only one technician / one measurer
- Two-way (without replicates)
- Measures 2 factors
- Uses only one technician (unless technicians are one of the factors)
- Two-way (with replications)
- Measures 2 factors but has multiple repetitions of each combination.
- Uses only one technician (unless the technicians are one of the factors)
ANOVA Sum of Squares Correction Factor
- Grand total of all runs (G) = ΣX
- N= Total number of runs
- Correction factor (CF)= (ΣX)2 /N = (G)2 /N
Terms used in ANOVA
- Degrees of Freedom (df): The number of independent conclusions that can be drawn from the data.
- SSFactor: It measures the variation of each group’s mean to the overall mean across all groups.
- SSError: It measures the variation of each observation within each factor level to the mean of the level.
- Main effect: A main effect is an effect where the performance of one variable is considered in isolation by neglecting other variables in the study.
- Interaction: An interaction effect occurs where the effect of one variable is different across levels of one or more other variables.
- Mean Square Error (MSE): The mean square of the error (MSE) is divided by the sum of squares of the residual error by the degrees of freedom.
- F-test Statistic: The null hypothesis that the category means are equal in the population is tested by F Statistic based on the ratio of mean square related to X and mean square related to the error.
- P-value: It is the smallest level of significance that would lead to rejection of the null hypothesis (Ho). If α = 0.05 and the p-value ≤ 0.05, then reject the null hypothesis. Similarly if the p-value > 0.05, then fail to reject the null hypothesis.
Analysis of Variance (ANOVA) has three types:
- One-way analysis
- Two-way analysis
- K-way analysis: K-Way ANOVA can be two-way ANOVA or three-way ANOVA, or multiple ANOVA
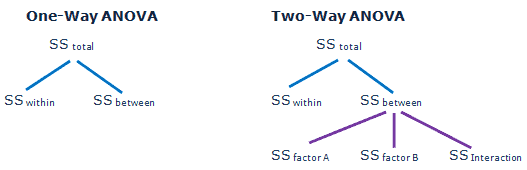
One way ANOVA
One-way ANOVA (one-way analysis of variance) is a statistical method to compare the means of two or more populations.
Assumptions of One-way ANOVA
- The sample data drawn from k populations are unbiased and representative.
- The data of k populations are continuous.
- The data of k populations are normally distributed.
- The variation within each factor or factor treatment combination is the same; hence, it is also called homogeneity of variance.
- Finally, the variances of k populations are equal.
Steps for Computing one-way ANOVA:
- Establish the hypotheses. H0: µ1= µ2= µ3 and H1: At least one group means differs from the others.
- In ANOVA, the total variance is subdivided into two independent variances: the variance due to the treatment and the variance due to random error.
- SST = SSb + SSw
- Calculate the ANOVA table with degrees of freedom (df), and calculate the group’s error and total sum of squares.
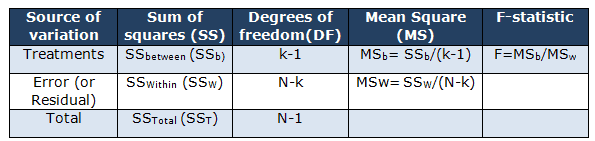
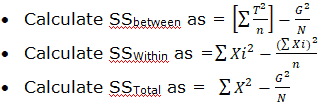
- SSb= sum of squares between treatments
- SSw= sum of squares due to error
- MSb= mean square for treatments
- MSW= mean square for error
- SST= total sum of squares
- T= number of treatment levels
- n= number of runs at a particular level
- N= total number of runs
- F= the calculation of the F Statistic with k-1, and N-k is the degrees of freedom.
- Determine the critical value. F critical value from the F distribution table.
- Finally, Draw the statistical conclusion. If Fcalc< Fcritical, fail to reject the null hypothesis, and if Fcalc > Fcritical, reject the null hypothesis.
Example of One-Way ANOVA
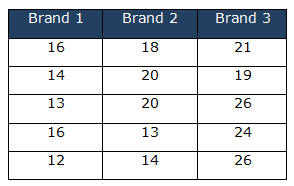
A car manufacturer planned to conduct tests to determine the performance of 3 different brands of 12V batteries, so he selected five batteries from each brand and discharged them under controlled conditions. Assuming the lifetime of batteries is normally distributed at a 95% confidence level. The hypothesis is that the three brands have no difference in lifetime.
H0: µ1= µ2= µ3
H1: At least one of the brands mean life is different from the others.
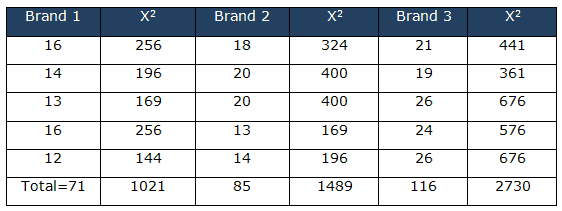
k = 3, n = 5, N = 15, T1 = 71, T2 = 85, and T3 = 116, and G = 272 ΣX2= 1021 + 1489 + 2730 = 5240
Correction factor (CF) = (ΣX)2 /N = (G)2 /N = (272)2/15

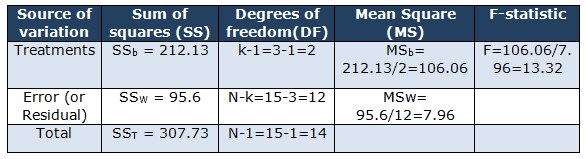
One-Way ANOVA Excel Download
A: analysis of variance (ANOVA). The other options don’t make any sense. In other words, An ANOVA is designed to compare three or more factors against each other- This is what happens in a designed experiment.
When you’re ready, there are a few ways I can help:
First, join 30,000+ other Six Sigma professionals by subscribing to my email newsletter. A short read every Monday to start your work week off correctly. Always free.
—
If you’re looking to pass your Six Sigma Green Belt or Black Belt exams, I’d recommend starting with my affordable study guide:
1)→ 🟢Pass Your Six Sigma Green Belt
2)→ ⚫Pass Your Six Sigma Black Belt
You’ve spent so much effort learning Lean Six Sigma. Why leave passing your certification exam up to chance? This comprehensive study guide offers 1,000+ exam-like questions for Green Belts (2,000+ for Black Belts) with full answer walkthroughs, access to instructors, detailed study material, and more.
Thousands have used this system to prepare. Join them here.

Comments (10)
What is the purpose of ANOVA?
An ANOVA usually is used to compare the means of three or more factors by using the F Distribution.
Hey,
In your Two Way ANOVA example of the lab/materials, I don’t know how understand what I am supposed to sum up for SStotal to get 201. I was hoping there was a workthrough on how you got each of those numbers for SStotal, SSwithin
Hello Alex,
I have updated the article to include detail calculations of SStotal, SSwithin, SSrowfactor, SScolumnfactor etc.
Hope this clarifies!
Thanks
This study guide saved my life thank you.
I’m so glad, Anna! We’re here to help!!
Hi Ted,
I’m currently reviewing one way ANOVA and have become a little confused.
I was watching through this video, and to calculate the SSW and SSB they have taken the mean of the sample away from each individual X before squaring. In your guidance it simply takes X squared only.
Do both approaches reach the same outcome, or is there a difference between the two and if so, why?
Kind regards,
Krishna
Hi Krishna Bholah,
Yes, both approaches yield the same outcome.
I applied the video example values to the formula in the article, resulting in SS(b) = 203.3, SS(w) = 54, and an F-value of 22.59.
Thanks
In the IASSC LSS black belt exam, are there questions that require ANOVA calculations?
Hi Patrick,
Yes. ANOVA is covered in multiple ways in the IASSC BB exam. See their BOK here.
Best, Ted.