One Sample T-Tests (Student’s T-Test) are used to resolve Hypothesis tests around comparing process means. The underlying chart makes use of the T-distribution.
Student’s T-distribution leverages the T-distribution and is used for finding confidence intervals for the population mean when the sample size is less than 30, and the population Standard Deviation is unknown.
What is a One Sample T Hypothesis Test?
The One Sample T Hypothesis Test (Student’s T-Test) allows one to compare the (small) population mean to some hypothesized value or one sample mean to determine if they are significantly different.
For example, if we know the average weight of chickens on a farm is 3lb, and compare the average weight of sample black hens to the population mean value.
When Would You Use a One Sample T Hypothesis Test?
One sample T-Test is a type of parametric test because the assumption is samples are randomly distributed. It tests whether the sample mean is significantly different than a population mean when the standard deviation of the population is unknown. Hence, a T-Test is used when the population standard deviation is unknown, and the sample size is below 30. Otherwise, use Z-test (for known variance).
Assumptions of One Sample T Hypothesis Test
- Data is continuous and quantitative at the scale level (in other words, data in ratio or interval).
- The sample should be randomly selected from the population.
- Samples are independent of each other.
- Data should follow a normal probability distribution.
- Assumes it doesn’t have extreme outliers in the dependent variable.
One Sample T Hypothesis test formula

- Where
- x̅ is observed sample mean
- μ0 is the population mean
- s is the sample Standard Deviation
- n is the number of observations in the sample
Steps to Calculate One Sample T Hypothesis Test
- State the claim of the test and determine the Null Hypothesis and Alternative Hypothesis.
- Determine the level of significance.
- Calculate degrees of freedom.
- Find the critical value.
- Calculate the test statistics.
- Make a decision, the Null Hypothesis will be rejected if the test statistic is in the rejection region.
- Finally, interpret the decision in the context of the original claim.
One Sample T-Test Hypothesis
Null Hypothesis (H0): The difference between the population mean and the hypothesized value is equal to zero.
Alternative Hypothesis (H1):
- The population mean is not equal to the hypothesized value (Two-tailed).
- The population mean is greater than hypothesized value (Upper-tailed).
- The population mean is less than hypothesized value (Lower-tailed).
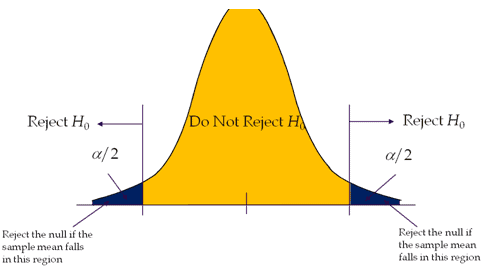
Two-Tailed T Test
A hypothesis test is performed if the population parameter is suspected to be different from the Null Hypothesis’s assumed parameter.
- H0: μ=μ0
- H1: μ≠μ0.
Right-tailed or Upper-tailed test
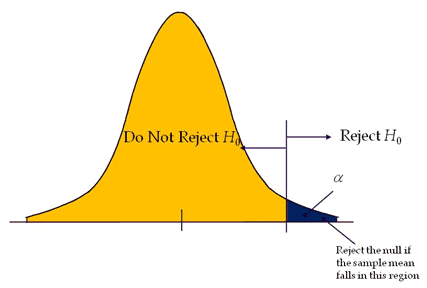
The Right-tailed test is also called the Upper-tail test. A hypothesis test is performed if the population parameter is suspected to be greater than the assumed parameter of the Null Hypothesis.
- H0: μ≤μ0
- H1: μ>μ0
Left-tailed test or Lower-tailed test
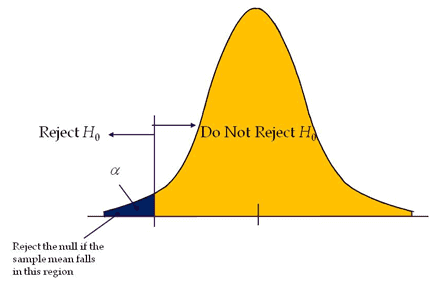
The Left-tailed test is also known as a Lower-tail test. A hypothesis test is performed if the population parameter is suspected to be less than the assumed parameter of the Null Hypothesis.
- H0: μ≥μ0
- H1: μ<μ0
Example of a One-Sample T Hypothesis Test in a DMAIC Project
One Sample T-Tests are mostly carried out in Analyze phase of DMAIC to check the significant differences between the population mean and the sample means, while paired T-Tests can be done in the Measure phase to review before and after process improvement (see below example for more details).
Example of Two-Tailed Test
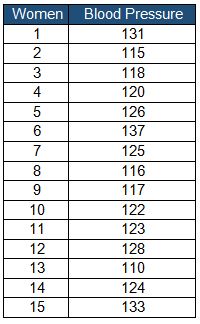
Example: According to the American Health Association, a pregnant woman’s average blood pressure is 120 mm Hg. Collected 15 random samples from pregnant women to check whether the sample blood pressure differs from accepted standard blood pressure.
- Null Hypothesis: H0: μ=120
- Alternative Hypothesis: H1: μ≠120
Significance level: α=0.05
Degrees of freedom: 15 – 1 = 14
Calculate the critical value
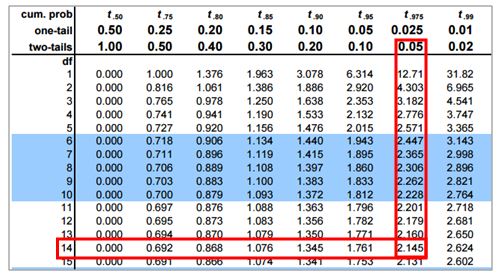
If the calculated t value is less than -2.145 or greater than 2.145, then reject the Null Hypothesis.
Test Statistics
- x̅ = 123
- μ0 = 120
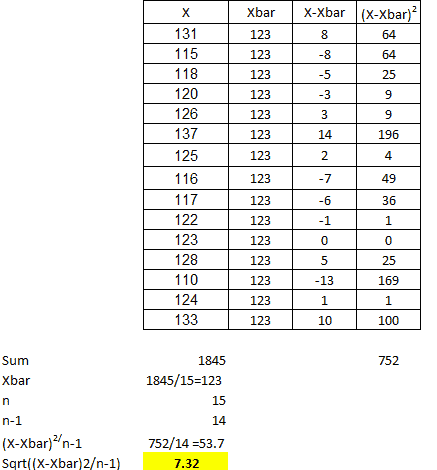
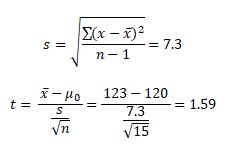
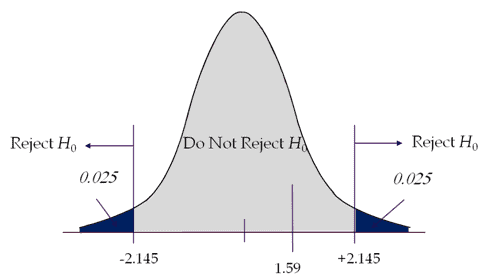
Interpret the results: Compare t calc to t critical. In hypothesis testing, a critical value is a point on the test distribution compared to the test statistic to determine whether to reject the Null Hypothesis. The calculated t-statistic value is less than the critical value; hence we failed to reject Null Hypothesis.
One Sample T Two-Tailed Test Excel Template
Right-tailed test
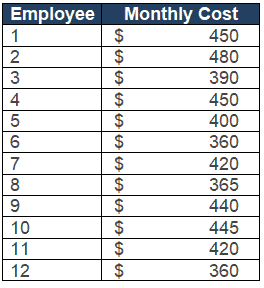
Example: A software start-up company plans to introduce company transportation based on the town hall meeting’s feedback. The admin manager randomly collected 12 employees’ spending on public transportation for the month. With a 95% confidence level, is there any evidence that the population mean is above $400?
- Null Hypothesis: H0: μ≤400
- Alternative Hypothesis: H1: μ>400
Significance level: α = 0.05
Sample size n =12
Degrees of freedom: 12 – 1 = 11
Calculate the critical value
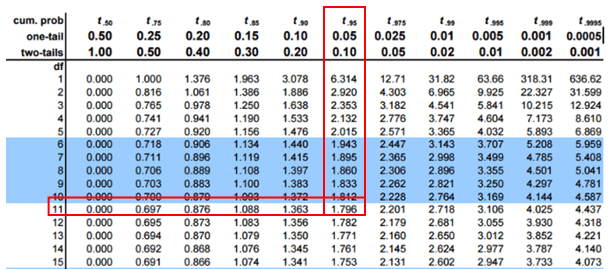
If the calculated t value is greater than 1.796, then, reject the Null Hypothesis.
Calculate the Test Statistics
- Sum of all samples =4980
- x̅ = Σx/n = 4980 / 12=415
- Σ(X-X̅)2 = 17650
- Σ(X-X̅)2 /n-1 = 1604.5
- Standard Deviations = √ Σ(X-X̅)2 /n-1 = 40
- μ0 = 400
- x̅- μ0 =15
- s/√n = 40/√12 = 11.6

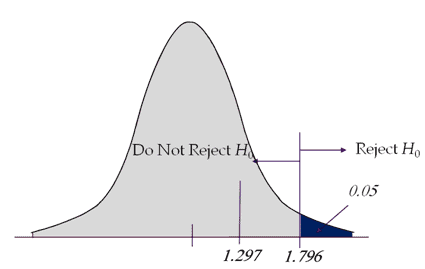
Interpret the results: Compare t calc to t critical. In hypothesis testing, a critical value is a point on the test distribution compared to the test statistic to determine whether to reject the Null Hypothesis. Since tcal value is less than t critical value and it is not in the rejection region. Hence we failed to reject the Null Hypothesis. There is no sufficient evidence to claim the population mean is above $400.
One Sample T Two-Tailed Test Excel Template
Left-tailed test
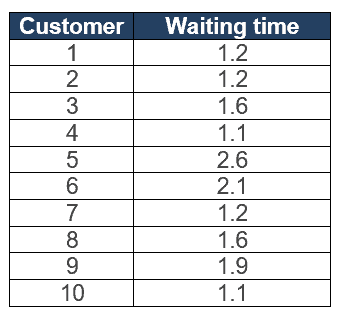
Example: The average waiting time for billing at XYZ restaurant is 1.9 minutes. The restaurant owner updated the billing software to reduce the waiting time. He randomly collected 10 customers waiting time at the billing counter. With a 95% confidence level, is there any evidence that the population’s average waiting time is less than 1.9 minutes?
- Null Hypothesis: H0: μ≥1.9
- Alternative Hypothesis: H1: μ<1.9
Significance level: α = 0.05
Sample size n = 10
Degrees of freedom: 10 – 1 = 9
Calculate the critical value
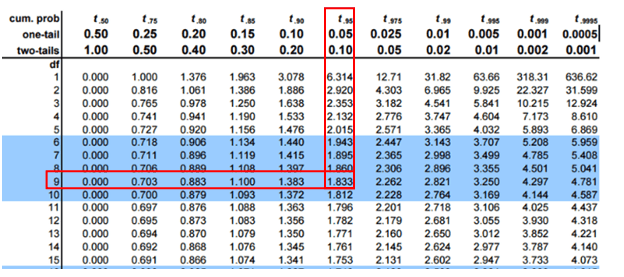
If the calculated t value is less than -1.833, then reject the Null Hypothesis.
Calculate the test Statistics
- Sum of all samples = 15.6
- x̅ = Σx/n = 15.6 / 10 = 1.56
- Σ(X-X̅)2 = 2.3
- Σ(X-X̅)2 /n-1 = 0.3
- Standard Deviations = √ Σ(X-X̅)2 /n-1 = 0.51
- μ0 = 1.9
- x̅- μ0 =-0.34
- s/√n = 0.51 / √10 = 0.16

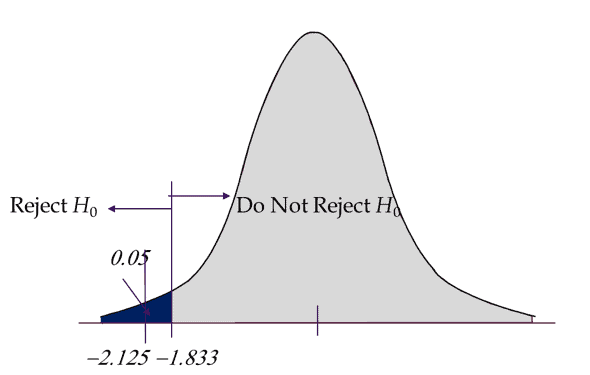
Interpret the results: Compare t calc to t critical. In hypothesis testing, a critical value is a point on the test distribution compared to the test statistic to determine whether to reject the null hypothesis. Since tcal value is less than the t critical value and it is in the rejection region. In other words, the absolute value of t calculated is greater than the t critical. Hence we reject the Null Hypothesis. There is sufficient evidence to claim the population mean is less than 1.9 minutes.
One Sample T Left Tailed Test Excel Template
One Sample T Hypothesis Test Videos
Additional One Sample T Hypothesis Test Resources
https://www.cliffsnotes.com/study-guides/statistics/univariate-inferential-tests/one-sample-t-test (One sample T-Test)
http://stattrek.com/probability-distributions/t-distribution.aspx
When you’re ready, there are a few ways I can help:
First, join 30,000+ other Six Sigma professionals by subscribing to my email newsletter. A short read every Monday to start your work week off correctly. Always free.
—
If you’re looking to pass your Six Sigma Green Belt or Black Belt exams, I’d recommend starting with my affordable study guide:
1)→ 🟢Pass Your Six Sigma Green Belt
2)→ ⚫Pass Your Six Sigma Black Belt
You’ve spent so much effort learning Lean Six Sigma. Why leave passing your certification exam up to chance? This comprehensive study guide offers 1,000+ exam-like questions for Green Belts (2,000+ for Black Belts) with full answer walkthroughs, access to instructors, detailed study material, and more.


Comments (14)
Hi, I don´t get it. What is the formula t = (xbar – u) / (s/Sqrt(n)) useful for? In the examples all results are drawn with T-values from the table. Can you clarify?
Thanks 🙂
Julio, in the examples we are trying to solve the confidence interval. We get the critical t value from the chart. We then substitute that value into the t equation to find the confidence interval. If you look closely, you’ll see that the t = equation has been rewritten for u = and the critical t value is substituted in.
Hope that helps!
Hi I’m conducting a survey research on brand consumption. My indecent variable is (1) total $ spent per month on brand products and (2) total number of brands owned. (Chosen from a list of brands on questionnaire)
My dependent variables are (1) social media usage (2)belief on importance of brand names and (3) self esteem.
My hypothesis is that (1) increased social Media usage increases brand consumerism
(2) belief on importance of brand names increase brand consumerism
(3) lower self esteem increases brand consumerism
What type of tests do I need to run to test my hypothesis? I have one way anova but I’m not sure if that’s right
Hi Vic,
That’s an interesting set up. I’ve added this question to my membership site and will review as part of the upcoming paid black belt course.
I am getting ready to take the IASSC Lean Six Sigma Green Belt Certification Test. You should prominently include the IASSC Examination Reference Document and the testing rules with your study guide
Hi Scott,
Making a reference page would be helpful – not only for IASSC candidates, but for all other candidates.
From their site: IASSC provides a Reference Document in either paper or electronic form, subject to which form of exam one is taking. This document contains all formulas and tables one will need during the examination.
I can’t seem to find a version on-line. Do you know if they publish one for public consumption?
IASSC FAQ page with link: https://www.iassc.org/faqs/
Direct link to document: http://5a41bed9b61d975bd10f-8fecbdcc17278c3210d508b7a2245787.r59.cf2.rackcdn.com/IASSC%20Reference%20Document%201218%20-%20English.pdf
Thanks, Melanie!
Example of Left Tail One-Sample t-Test is incorrect. The Critical Value has to be -1.8333 and tcalc is +1.72 and hence Ho should not be rejected.
Hello Manish,
The left tail one sample t-test example is correct and even we cross-checked in Minitab (see below Minitab output).
One-Sample T: Waiting time
Test of mu = 1.9 vs < 1.9
95%
Variable: Waiting Time,
N: 10,
Mean:2.2,
StDev 0.55176,
95% UpperBound: 2.51985,
T: 1.72,
P: 0.940
The issues are with T critical as well as with the graph.
T critical is -1.8333, not +1,8333
Also the graph showing the two values of 1.72 and 1.8333 is incorrect – values to the left of the mean are negative, and the value increases the further it is away from the mean. As such, 1.72 would need to be closer to the mean than 1.8333.
Thank you Wiebke Zuch, for the feedback.
For better clarity, we also updated the numerical values in the example and the graphs to show negative values.
Thanks
Regarding the dog weight question, can you tell me why we didn’t need to divide alpha by 2 (.025) for the two tailed unequal variance t test?
April-Lynn,
Do you mean the example here?
Best, Ted.