

What is the F-Distribution?
The F-distribution, also known as the Fisher-Snedecor distribution, is extensively used to test for equality of variances from two normal populations. F-distribution got its name after R.A. Fisher, who initially developed this concept in the 1920s. It is a probability distribution of an F-Statistic.
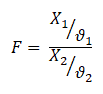
The F-distribution is generally skewed and also related to a Chi-Squared distribution. Additionally, the f-distribution is the ratio of the X1 random chi-square variable with degrees of freedom ϑ1 and the X2 random chi-square variable with degrees of freedom ϑ2. In other words, each Chi-Square random variable has been divided by its degrees of freedom.
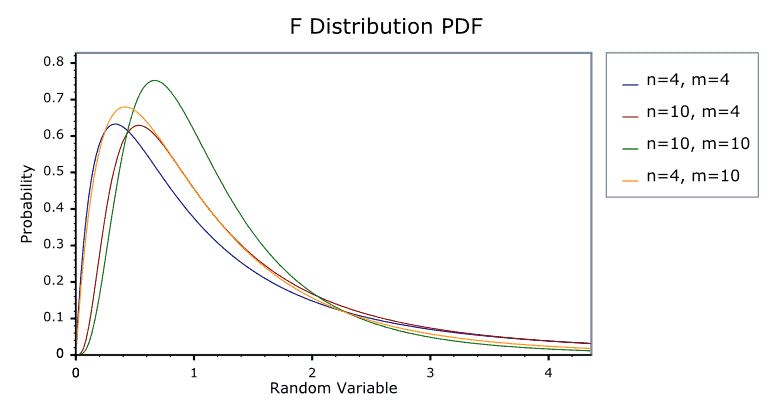
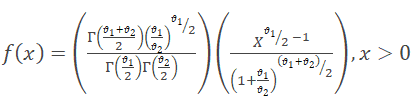
The shape of the distribution depends on the degrees of freedom of numerator ϑ1 and denominator ϑ2.
What are the properties of an F-distribution?
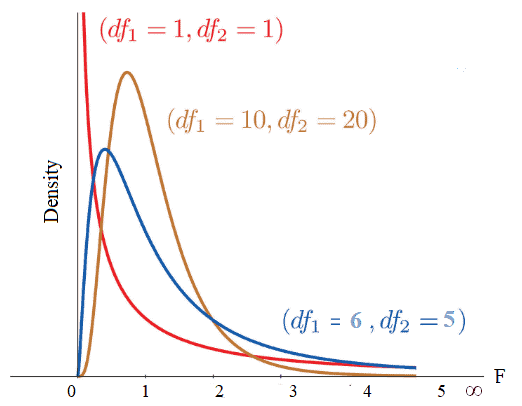
- The F-distribution curve is positively skewed towards the right with a range from 0 to ∞.
- The value of F is always positive or zero. No negative values.
- The shape of the distribution depends on the degrees of freedom of numerator ϑ1 and denominator ϑ2.
- From the above graph, it is clear that the degree of skewness decreases with an increase in the degrees of freedom of the numerator and denominator.
- The f-distribution curve can never be symmetrical; as the degrees of freedom increase, it becomes more nearly symmetrical.
When would you use the F-distribution?
The F-test compares more than one level of independent variable with multiple groups, which uses the F distribution. This is generally used in ANOVA calculations. When you compare the means of more than two groups, ANOVA’s F-test is the standard choice.
Example: In a manufacturing unit, torque values are key parameters in terminal squeeze welding. To check the significant effect of various torque (N·m) values of the squeeze welding, an operator set up trials of 5, 8, 10, and 12 N·m on terminals in four randomly selected batches of 30. ANOVA can determine whether the means of these four trials are different. ANOVA uses F-tests to statistically test the equality of means.
Assumptions of F-distribution
- Assumes both populations are normally distributed.
- Both populations are independent of each other.
- The larger sample variance always goes in the numerator so the test is right-tailed, which keeps the table lookup simple.
F-distribution Videos
Related Topics
Once you understand the F-distribution, see the F-Test page for how it’s actually used to compare variances, including the F-statistic calculation and worked examples for right-tailed, two-tailed, and left-tailed tests. For the full mathematical treatment and critical value tables, NIST’s Engineering Statistics Handbook is a reliable reference.
Worked Example: Calculating an F-Statistic
Two suppliers produce the same part. Supplier A’s output has a sample variance of 4.2; Supplier B’s has a sample variance of 1.8. To test whether A’s process is genuinely more variable (not just unlucky sampling), put the larger variance in the numerator: F = 4.2 / 1.8 = 2.33. Compare that F-statistic to the critical value from an F-table at your chosen alpha and the two samples’ degrees of freedom. If 2.33 exceeds the critical value, you have statistical grounds to say Supplier A’s process really is more variable, not just different by chance.
A Consistency Example
The F-ratio is really a consistency comparison, and sports commentary makes this intuitive without any statistics vocabulary: “Team A is more consistent than Team B” is an informal F-test. If Team A scores between 2 and 4 runs almost every game and Team B swings wildly between 0 and 10, Team B has the larger variance. The F-distribution is just the formal, mathematical version of “how much more variable is one thing than another, and is that difference big enough to call real.”
F-Distribution in Practice: Before You Run a T-Test
One practical place the F-distribution shows up before you even get to ANOVA: deciding whether to run a pooled or unpooled (Welch’s) two-sample t-test. An F-test (or a simpler rule of thumb comparing standard deviations) checks whether the two groups’ variances are close enough to pool. If they’re not, using the pooled t-test formula anyway can throw off your results, which is why many statistical software packages run this variance check automatically before showing you the t-test output.
Frequently Asked Questions
Can an F-statistic be negative? No. Since it’s a ratio of two variances, and variances can never be negative, the F-statistic is always zero or positive.
What’s the difference between the F-distribution and the F-test? The F-distribution is the underlying probability distribution; the F-test is the hypothesis test that uses it to compare two variances (or, in ANOVA, to compare multiple group means at once by comparing variance between groups to variance within groups).
Why does the F-distribution need two separate degrees-of-freedom values? Because it’s a ratio of two independent chi-square variables, and each one has its own sample size behind it. The numerator degrees of freedom come from one group’s sample size, the denominator’s from the other’s, which is why an F-table has two axes instead of one.
What happens as both degrees of freedom get large? The F-distribution flattens out and becomes more symmetric, approaching a normal shape as sample sizes grow. With small samples it stays visibly right-skewed, which is part of why F-tests are sensitive to small sample sizes and why a reasonably sized sample matters for a reliable result.
Keep the ANOVA page and the F-Test page bookmarked alongside this one; together they cover the full path from “what is this distribution” to “how do I actually run the test” to “how do I use it to compare more than two groups at once.”