Mood’s median test is a nonparametric test to compare the medians of two independent samples. It is also used to estimate whether the median of any two independent samples is equal. Therefore, Mood’s median non parametric hypothesis test is an alternative to the one-way ANOVA. This test works when the dependent variable is continuous or discrete count, and the independent variables are discrete with two or more attributes.
Mood’s median test is a rudimentary two-sample version of the sign test. This test can be applied to more than two samples, but it is not as powerful as Kruskal-Wallis Test.
While Mood’s median test is more useful for smaller sample sizes when the data contains few outliers because this test only focuses on median value instead of ranks.
Usually, the researchers prefer the Wilcoxon Rank Sum test or Mann-Whitney U test as they provide more robust results when compared to Mood’s Median Test.
The Mood’s median test compares whether K-independent samples have either drawn from the same population or from populations with equal medians.
Assumptions of the Mood’s Median Test
- The Observations are independent both within and between samples.
- The Observations come from a population with a continuous distribution function
- The distributions of the populations the samples were drawn from all have the same shape.
Uses of Mood’s Median Test
Following are a few examples where Mood’s median test can be used:
- The Moods median test is to compare the medians of customer satisfaction level (dependent variable) of different account holders (independent variables: current account and savings account customers).
- To compare the medians of machining times of different production lines in a manufacturing plant (Lines 1, 2, and 3 )
Procedure to execute Mood’s Median Non Parametric Hypothesis Test
- Compute the overall median (M) of the combination of k samples—list all the data into a single set and sort the data into ascending order, finally find the middle number (median M)
- Count the number of observations that is greater than the overall median (M), and then count the observations that are equal to or less than the median (M).
- Create a 2xk contingency table with the above data
- Compute the chi-square test for the completed contingency table
- Compare the calculated value with the chi-square critical value
- Finally, formulate a decision and conclusion
Calculation of Mood’s Median Test
The Mood’s Median Test is used to determine whether there is sufficient evidence to conclude that samples are drawn from populations with different medians. The test statistic used is the chi-square test statistic
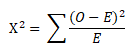
Where O is Observed Frequency and E is the Expected Frequency
- Null Hypothesis H0: The medians of the populations all are equal
- Alternative Hypothesis H1: The medians of the population are not all equal (at least one population median is different)
DF= (rows-1)*(columns-1)
Example of Mood’s Median Non Parametric Hypothesis Test
A major wheat supplier from Texas is analyzing the yields of various crop methods. He randomly assigned two different wheat crop methods to a very high number of different acres of farmland and recorded the production rate (yield per acre) for each plot.
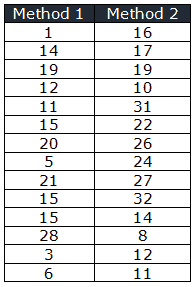
Step 1: Calculate the total median from two methods. First sort the data into ascending order and find the middle number
1,3,5,6,8,10,11,11,12,12,14,14,15,15,15,16,17,19,19,20,21,22,24,26,27,28,31,32
Overall Median = 15 + 15 / 2 = 15
Step 2: Create a 2X2 contingency table from the above values

Step 3: Perform Chi-square (χ2) test
Observed Frequencies :
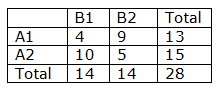
Expected Frequencies :
Expected value for each cell= row total * column total/grand total
(A) Cell (A1XB1) = 14 * 13 / 28 = 6.5
(B) Cell (A2XB1) = 14 * 15 / 28 = 7.5
(C) Cell (A1XB2) = 14 * 13 / 28 = 6.5
(D) Cell (A2XB2) = 14 * 15 / 28 = 7.5

Step 4: Compute the degrees of freedom = (2 – 1) * (2 – 1) = 1
Critical value of χ2 (0.05, 1) = 3.841

Step 5: Calculated χ2 value is less than the critical value of χ2 for a 0.05 significance level, hence we have no convincing evidence to reject the null hypothesis
So, the data are consistent with the null hypothesis that there is no difference between the two wheat crop methods.
Six Sigma Black Belt Certification Mood’s Median Test Questions:
Question: What statistical test would be used to compare medians of two independent samples?
A) Wlcoxon Ranked Sum test
(B) Mann-Whitney U test
(C) Mood’s Median test
(D) All the above
Answer:
When you’re ready, there are a few ways I can help:
First, join 30,000+ other Six Sigma professionals by subscribing to my email newsletter. A short read every Monday to start your work week off correctly. Always free.
—
If you’re looking to pass your Six Sigma Green Belt or Black Belt exams, I’d recommend starting with my affordable study guide:
1)→ 🟢Pass Your Six Sigma Green Belt
2)→ ⚫Pass Your Six Sigma Black Belt
You’ve spent so much effort learning Lean Six Sigma. Why leave passing your certification exam up to chance? This comprehensive study guide offers 1,000+ exam-like questions for Green Belts (2,000+ for Black Belts) with full answer walkthroughs, access to instructors, detailed study material, and more.

Comments (10)
sorry sir,
as you mentioned before ” Mann-Whitney test will helps to compare the medians of the two populations.”
so why Answer C is the right answer? also Mann-whitney is alternative to two sample t test and mood median is alternative to one way anova
Hi Mohamed,
By definition Moods is for MEDIANs of independent samples.
Mann-Whitney is for MEANS.
Mean and Median are different concepts.
Hope this helps.
Best, Ted.
Hi Ted
I think in non parametric test you compare Median not mean
the difference between mood median and kruwals is that mood median is with outliers and kriswlas is without outliers
Hi Youssef Boudoudouh,
Mood’s median test and Kruskal-wallis compares the medians of two independent samples, but all non parametric tests are not compare the medians of two populations. In the above explanation Ted talking about Mann-Whitney U Test.
Mann-Whitney test is a non-parametric test that is to compare two sample means that may come from the same population, and used to test whether two sample means are equal or not.
You said:
Step 5: Calculated χ2 value is less than the critical value of χ2 for a 0.05 significance level, hence failed to reject the null hypotheses.
So, there is enough evidence to conclude that all population medians are equal.
This is not correct. Failure to reject the null should not lead you to conclude that the null is true. It simply says that there is not strong evidence against the null. If you want to assert that the population means/medians are the same, you use an equivalence test (e.g., TOST).
Thanks Greg,
For better clarity i have updated the verbiage in the step #5
Thanks
Hello Ramana,
thanks for this page about the Mood’s median test.
Shouldn’t the value of cell A1B1 be 5, as there are 5 values (namely, 20,21, 21, 24, 29) greater than 15?
Best regards.
Hello Francesco De Angelis
Somehow old data file existed in the system. I have uploaded the correct “Production rate” picture.
Thanks for your feedback.
Best Regards.
Mann Whitney test does not directly compare means or medians. Instead, it compares the distribution of ranks of data points between the two samples
You are correct Zeina Mneimneh,
The Mann-Whitney U test is a non-parametric statistical test used to compare two independent samples. It assesses whether the distribution of values in one sample is stochastically greater or less than the distribution of values in another sample.
This test does not specifically compare sample means, but rather it evaluates whether the two samples come from the same population or if one tends to have higher values than the other.
Thanks