What are T Distributions and T Tests?
Student’s t-distribution is used for finding confidence intervals for the population mean when the sample size is less than 30 and the population standard deviation is unknown. Further, Students’ t-test is divided into paired and unpaired t-tests. In other words, the t-distribution and t-tests are used to determine the likelihood of various conditions occurring for small sample sizes (<=30).
How Does the T Distribution Compare with the Z Distribution?
The z-distribution assumes a known standard deviation of the population, whereas the t-distribution is based on the sample standard deviation. The t-distribution is flatter and wider than the z-distribution.
The t-distribution becomes narrower (taller) as sample sizes increase and gradually becomes very close to the Normal Distribution. Both z and t-distributions are symmetric and bell-shaped, with a mean of zero.
Hypothesis Testing
A tailed hypothesis is an assumption about a population parameter. The assumption may or may not be true. The one-tailed hypothesis tests the hypothesis where the area of rejection is only in one direction. Whereas two-tailed, the area of rejection is in two directions. The selection of one or two-tailed tests depends upon the problem.
- Null hypothesis- H0: The population means are the same; alternatively, the difference between the two population means is equal to the hypothesized difference (d). So, µ1 = µ2 orµ1– µ2 = d
- Alternative hypothesis: µ1 ≠ µ2 orµ1– µ2 ≠ d (Two-tailed test)
- µ1 < µ2 orµ1– µ2 < d (left-tailed)
- µ1 > µ2 orµ1– µ2 > d (Right-tailed)
What is T-score?
A t-score is the number of standard deviations from the mean in a t-distribution. You can typically look up a t-score from the t-table.
T-scores are primarily used to find:
- Upper and lower bounds of a confidence interval of normally distributed data.
- The p-value of the test statistic.
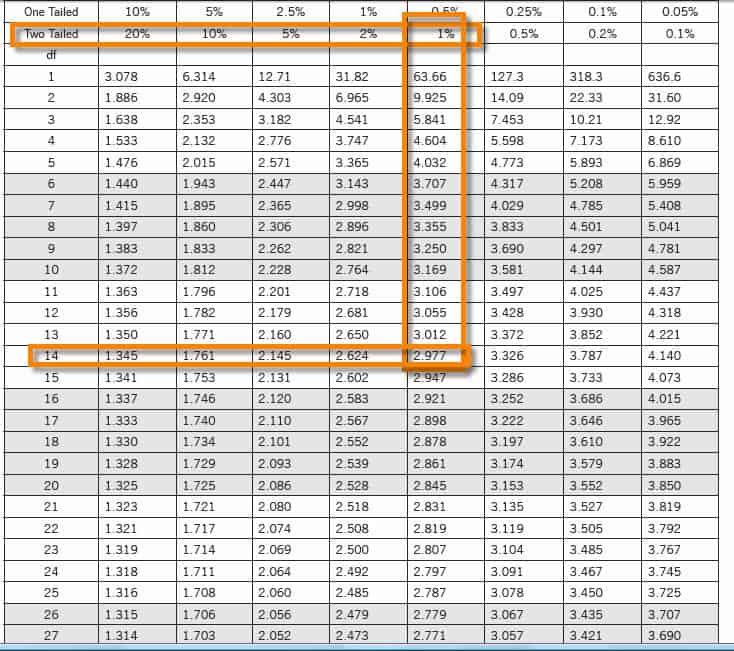
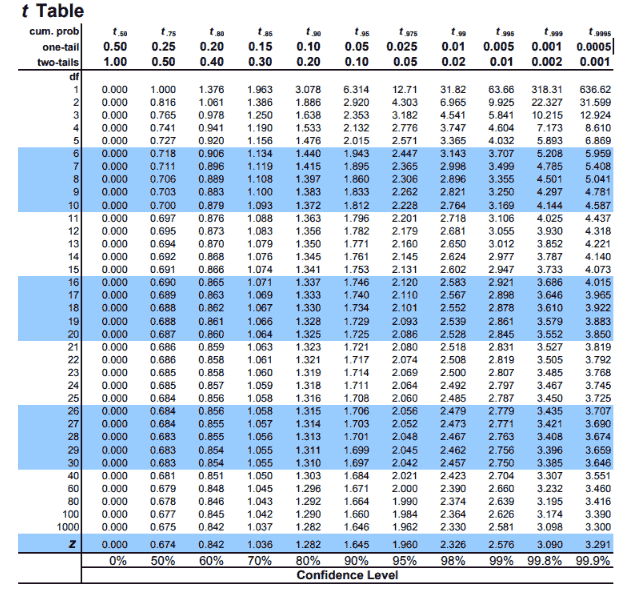
What is the T Distribution Table?
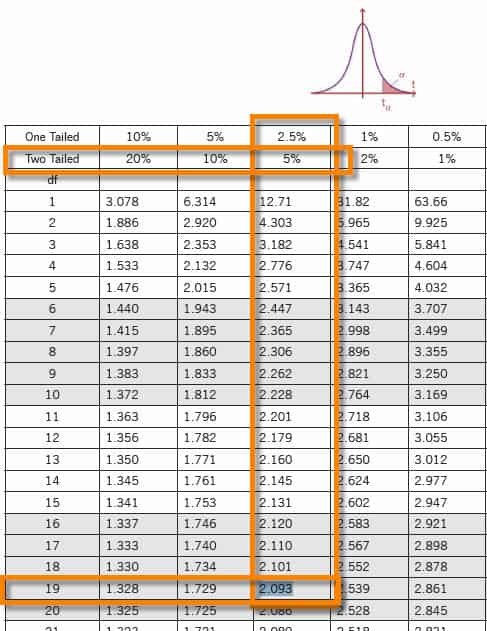
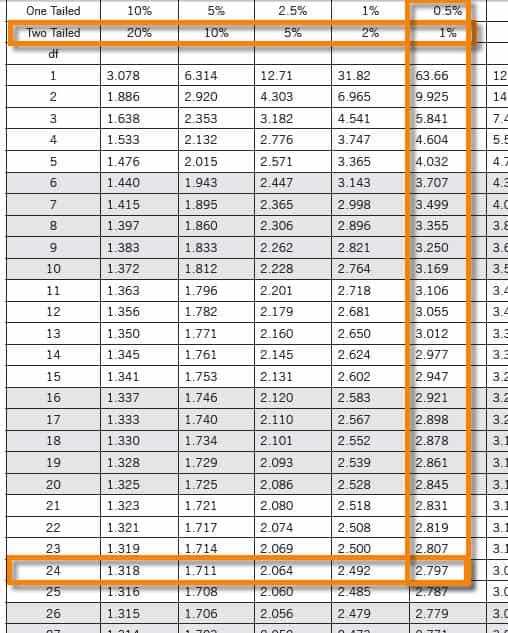
The t-distribution table values are critical values of the t-distribution. The column header is the t-distribution probabilities (alpha). The row names are the degrees of freedom (df). Student t-table gives the probability that the absolute t value with a given degrees of freedom lies above the tabulated value.
http://www.sthda.com/english/wiki/t-distribution-table
- The degrees of freedom of the t-test
- The number of tails of the t-test (one-tailed or two-tailed)
- The alpha level of the t-test (common choices are 0.01, 0.05, and 0.10)
When Would You Use a T Distribution or a T Distribution Table?
T-distributions are most likely used to compare two process means. It is a hypothesis test of means.
You would use these in the following specific hypothesis tests:
- One-Sample T-Test: The One Sample T-Hypothesis Test (Student’s T-Test) allows for comparing the (small) population mean to some hypothesized value or one sample mean to determine if they are significantly different.
- Two-Sample T-Test: A two-sample t-hypothesis test, also known as an independent t-test is used to analyze the difference between two unknown population means. The two-sample t-test is used when the two small samples (n< 30) are taken from two different populations and compared. The underlying chart makes use of the T distribution.
- Paired T-Test: A paired t-test (Paired T-Distribution, Paired T-Test, Paired Comparison test, Paired Sample Test) is a statistical method to test whether the average difference between the two measurements is statistically significant from zero.
Student’s T Distribution Example Questions
We can use Student’s t-distribution to find confidence intervals for the population mean when the sample size is less than 30, and the population standard deviation is unknown.
Confidence of a mean 1
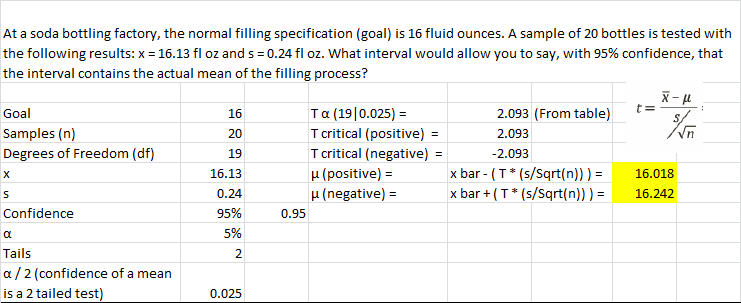
At a soda bottling factory, the normal filling specification (goal) is 16 fluid ounces. A sample of 20 bottles is tested with the following results: x = 16.13 fl oz and s = 0.24 fl oz. What interval would allow you to say, with 95% confidence, that the interval contains the actual mean of the filling process?
Confidence of a mean 2
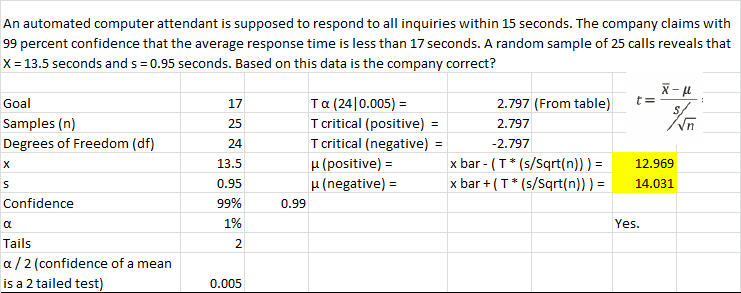
An automated computer attendant must respond to all inquiries within 15 seconds. The company claims with 99 percent confidence that the average response time is less than 17 seconds. A random sample of 25 calls reveals that X = 13.5 seconds and s = 0.95 seconds. Based on this data, is the company correct?
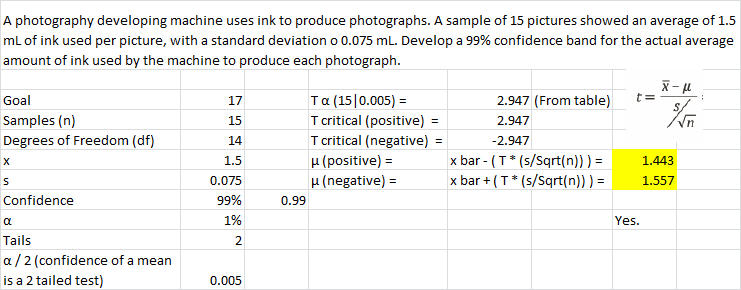
Confidence of a mean 3
A photography-developing machine uses ink to produce photographs. A sample of 15 pictures showed an average of 1.5 mL of ink used per picture, with a standard deviation o 0.075 mL. Develop a 99% confidence band for the actual average amount of ink the machine uses to produce each photograph.
Confidence Interval Question Using T-Score
Question: A factory produces tennis balls. Quality control takes a sample of 19 balls from one day’s production in the factory. The mean weight of the sample balls is 58.2g. The standard deviation for the sample balls is 0.4g. Calculate the confidence interval with a confidence level of 95%.
Calculation: The sample size is too small to use a Z-score. Instead, use a T-score, which uses a t-distribution. Finding a confidence interval for a mean is a two-tailed test.
You’ll need an alpha score. To calculate it, use this simple equation:
α = (100% – confidence level%)= (100% – 95%) = 5%
You also need the degrees of freedom (df), which is the number of samples minus one. Or in equation form:
df = n – 1
df for this question is 18.
So, use a T-table to look up the T-score needed for a two-tailed test with an α of 5% and a df of 18: the answer is 2.101.
tα/2=2.101, X̅=58.2, σ=0.4 and n=19
Margin of error E =tα/2*σ/√n = 2.101*0.4/√19 = 0.192
Confidence interval = X̅±tα/2*σ/√n = 58.2±0.192
Answer: Hence, a 95% confidence interval for tennis balls produced in the factory is 58.008–58.392g.
