The Friedman Non Parametric hypothesis test is an alternative to the one-way ANOVA with repeated measures. The Friedman Test was developed by the American economist Milton Friedman in the 1930s as a non-parametric alternative to repeated measures ANOVA. His foundational work includes publications from 1937, 1939, and 1940 that formalized ranking-based analysis across matched groups.
The Friedman Non Parametric hypothesis test is to test for differences between groups (three or more paired groups) when the dependent variable is at least ordinal. Friedman test is preferred when compared to other non parametric tests in a situation where the same parameter has been measured under different conditions on the same subject. Example: Patient Serum content monitoring before treatment, after one month, and after three months of treatment.
Friedman’s test is similar to the Kruskal-Wallis Test and also an extension of the sign test. This test is the best statistic to use for a repeated measures type of experiment to determine if a particular factor also has an effect.
The Friedman test is designed to test whether the k paired samples (k>2) of n size, are from the same population or the samples from populations having similar properties, considering the position parameter.
While the Friedman Test is robust and non-parametric, it’s important to note that it generally has less statistical power than parametric methods like repeated measures ANOVA, especially when parametric assumptions are met. This means it may be less likely to detect actual differences when they exist.
Assumptions of the Friedman Test
- The group is a random sample from the population
- No interaction between blocks (rows) and treatment levels (columns)
- The one group that is measured on three or more different occasions
- Data should be at least an ordinal or continuous
- The samples do not need to be normally distributed
Procedure to conduct Friedman Test
- Rank each row (block) together and independently of the other rows. When there are ties, the average ranks of the observations.
- Sum the ranks for each column (treatments) and then sum the squared columns’ total
- Compute the test statistic
- Determine critical value from the Chi-Square distribution table with k-1 degrees of freedom
- The Friedman statistic can be approximated by a chi-square distribution with (k – 1) degrees of freedom when the sample size is large enough. A common guideline is that n should be greater than 15, or the number of treatments (k) should be greater than 4, for the approximation to be reliable. For smaller datasets, exact critical values should be used instead.
- Formulate decision and conclusion
Calculation of Friedman Non Parametric Hypothesis Test
The test statics of Friedman’s test is
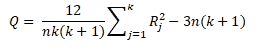
where Rj is the sum of the ranks for sample j.
n is the number of independent blocks
k is the number of groups or treatment levels
DF= number of groups -1 (k-1)
- Null Hypotheses H0: Median treatment effects of the population are all the same
- Alternative Hypotheses H1: There is a difference in treatment effects.
If the Friedman test indicates a statistically significant difference, it does not tell you which groups differ. To determine this, post-hoc tests such as the Nemenyi or Conover tests should be applied to perform pairwise comparisons.
Example of Friedman Non Parametric Hypothesis Test
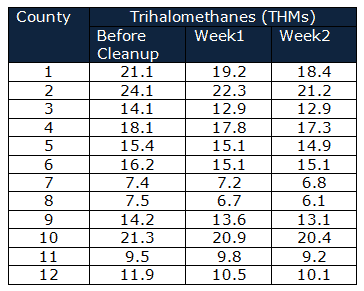
Department of Public health and safety monitors whether the measures taken to clean up drinking water were effective. Trihalomethanes (THMs) in 12 counties drinking water compared before cleanup, 1 week later, and 2 weeks after cleanup.
- Null Hypothesis H0 = the cleanup system had no effect on the THMs
- Alternative Hypothesis H1= the cleanup system effected the THMs
Significance level α=0.05
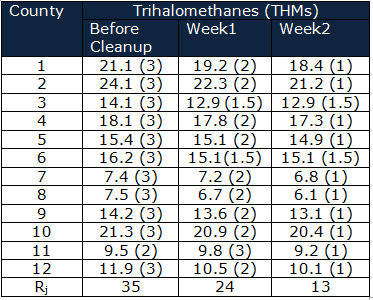
Calculate the Rj
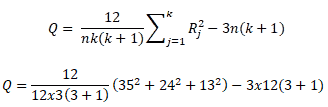
Q=20.16
For the values of independent blocks (n) greater than 20 and/or values of groups (k) greater than 6, use χ2 table with k-1 degrees of freedom otherwise use the Friedman table
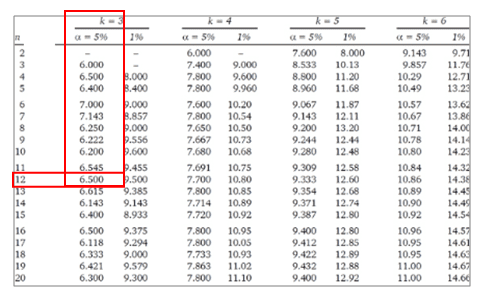
The calculated Q value is greater than the critical value of Q for a 0.05 significance level. Qcalculated >Qcritical hence reject the null hypotheses.
So, it is concluded that the cleanup system effected the THMs of drinking water
Six Sigma Black Belt Certification Friedman Non Parametric Test Questions:
Question: A psychologist monitored the same group of students’ reactions while watching comic films and compared the students’ reactions when watching political and drama films. The tabulated data is skewed. Which of the following test to be used to analyze the data?
(A) Mood’Median test
(B) Kruskal-Wallis test
(C) Mann-Whitney U test
(D) Friedman Test
Answer:
When you’re ready, there are a few ways I can help:
First, join 30,000+ other Six Sigma professionals by subscribing to my email newsletter. A short read every Monday to start your work week off correctly. Always free.
—
If you’re looking to pass your Six Sigma Green Belt or Black Belt exams, I’d recommend starting with my affordable study guide:
1)→ 🟢Pass Your Six Sigma Green Belt
2)→ ⚫Pass Your Six Sigma Black Belt
You’ve spent so much effort learning Lean Six Sigma. Why leave passing your certification exam up to chance? This comprehensive study guide offers 1,000+ exam-like questions for Green Belts (2,000+ for Black Belts) with full answer walkthroughs, access to instructors, detailed study material, and more.

Comments (9)
Second video is unavailable
Thanks, Lori. I’ve removed the missing video.
Como é determinada a significância do teste?
Olá Luiz,
Primeiramente, gostaria de avisar que só conheço algumas palavras em português, então usei um serviço de tradução para escrever esta resposta. Peço desculpas por qualquer erro!
Excelente pergunta! A significância do teste de Friedman é determinada por meio do valor-p (p-value), que indica a probabilidade de que as diferenças observadas entre os grupos sejam devidas ao acaso. Após calcular o valor da estatística de teste de Friedman, você compara o valor-p obtido com o nível de significância previamente definido (por exemplo, 0,05). Se o valor-p for menor que o nível de significância, você rejeita a hipótese nula, concluindo que há diferenças estatisticamente significativas entre os grupos avaliados.
Se quiser se aprofundar em testes estatísticos e conceitos fundamentais de Six Sigma, recomendo explorar nossos recursos sobre o Green Belt e o Black Belt, onde abordamos hipóteses, testes não paramétricos e muito mais.
Se precisar de mais detalhes sobre o cálculo ou interpretação dos resultados, estou à disposição!
Warm regards,
Ted
SixSigmaStudyGuide.com
English Translation:
Hello Luiz,
First, I’d like to let you know that I only know a few words in Portuguese, so I used a translation service to write this reply. I apologize for any errors!
Excellent question! The significance of the Friedman test is determined through the p-value, which indicates the probability that the observed differences between the groups are due to chance. After calculating the Friedman test statistic, you compare the resulting p-value with the pre-defined significance level (for example, 0.05). If the p-value is less than the significance level, you reject the null hypothesis, concluding that there are statistically significant differences among the evaluated groups.
If you’d like to dive deeper into statistical tests and core Six Sigma concepts, I recommend exploring our resources on the Green Belt and Black Belt, where we cover hypothesis testing, non-parametric tests, and much more.
If you need more details about the calculation or interpretation of the results, I’m here to help!
Best,
Ted
SixSigmaStudyGuide.com
Excellent
Glad you like it, Murad.
What about friedman but on case of ties
Great question! Ties are indeed an important consideration in the Friedman Non-Parametric Hypothesis Test. When ties occur in the data ( that is, when two or more treatments have the same value within a block), we handle them by assigning the average rank to the tied observations. This is similar to how ties are treated in other rank-based non-parametric tests, like the Kruskal-Wallis test.
For example, suppose in one block (subject) the observed values for three treatments are 2, 2, and 4. The first two values are tied for first and second place, so we assign them both the average rank of (1 + 2) / 2 = 1.5, and the third value receives a rank of 3. These ranks are then used in calculating the Friedman test statistic.
It’s worth noting that the presence of ties slightly reduces the test’s sensitivity (i.e., statistical power), as it affects the distribution of ranks. However, the correction using average ranks ensures the test remains valid and interpretable.
If you’re applying the Friedman test by hand or using statistical software, most modern tools handle ties automatically in this manner.