Analyze phase is the third phase of DMAIC. The main activity in the Analyze phase is to identify the potential root cause of the problem and arrive at the actual root cause. In other words, let’s use the data obtained in the Measure Phase to identify the root causes that we want to fix.
During the measure phase of DMAIC, the project team should clearly understand the problem statement. Six sigma teams use various statistical tools in the Analyze phase to identify the root cause(s).
Six Sigma Phases
Six Sigma is a systematic problem-solving approach that is centered around defect elimination and variation reduction. This leads to process improvement.
One of the principal tools in Six Sigma is using the DMAIC methodology. (Also see DMAIC Overview). Particularly, DMAIC is a logical framework that helps you think through and plan improvements to a process to achieve a Six Sigma level of excellence.
There are five phases that are used in the DMAIC method.
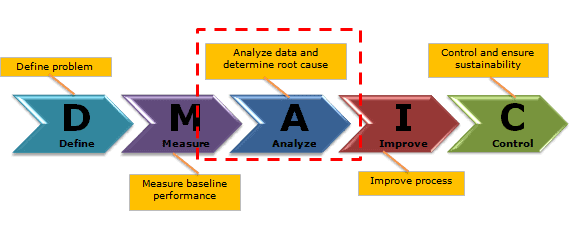
During the Analyze phase, use the data-driven approach to identify the problem’s root cause(s). Often, teams conclude the root cause without proper analysis; hence, the Analyze phase is critical in DMAIC. At the end of this phase, the six sigma team identifies the most significant impact on CTQs.
Analyze Phase of DMAIC Goals
- Use measure data to identify the probable causes of the problem
- Identify the actual root cause using brainstorming, 5 why, and other techniques
- Find the critical root cause that has the highest impact on CTQ
- Verify the root causes using appropriate statistical tools and techniques like hypothesis testing
Analyze Phase of DMAIC Overview
The Analyze phase is approximately 2 to 3 weeks process based on the project inputs. In particular, all the relevant stakeholders’ involvement is key in identifying the root causes.
The Analyze phase is all about reviewing the process map to improve efficiency, listing the probable root causes, and identifying important factors/inputs that greatly impact the output using statistical tools like hypothesis testing. Multiple tools and concepts are available in the Analyze phase of Six Sigma.
Process map Analysis (Identify Value and non Value activities)
Detailed Process Map: A process map is a tool that graphically shows the inputs, actions, and also outputs of a process in a clear, step-by-step map of the process.
The process map illustrates the relationship between inputs (X) and outputs (Y). Create a process map of all the activities required to convert raw materials into output (Y) and then identify the critical to quality (CTQs) factors in the process.
Value Stream Mapping: Value stream mapping visually represents the flow of materials and information throughout the organization. Value stream mapping constitutes all the value-added as well as non-added values required to make the product. It consists of the process flows starting from the raw materials to making the product finally available in the hands of the customers.
Waste Analysis
Classic Wastes are looked at as a blockage against productivity. It is not possible to enhance the top line in a highly competitive world by increasing the prices. Hence, it is necessary to build effective systems, and one of the ways is to understand the ‘wastages’ and eliminate them. Following are the seven classical wastes in an organization.
- Overproduction: This wastage occurs when the production output is much more than the requirement of the next process or customer.
- Inventory: Inefficient planning of inventory and ordering either less or more of inventory further leads to wastage.
- Waiting: Wastage of the operator time in avoidable events like failure of equipment, late arrival of necessary tools, lack of trained staff, inefficient planning, and idle machine time leads to wastage.
- Motion: Wastage due to unnecessary movement of parts and products between different processes and places.
- Defects: Defects and broken parts add to customer dissatisfaction, and the company would be busy solving problems, reworking, and even paying off to the customers for the defects.
- Over-processing: Unnecessary performance of any process due to design failure or usage of poor quality tools and processes.
- Transport & Handling: This Muda can be observed in many activities, like shipping damage and packing material wastage.
List Potential Causes
The focus of analyze phase is to identify the possible root causes of the problem.
Root Cause Analysis: Root cause analysis is a collection of tools and processes we can use to determine the most important causes for an issue we are trying to resolve.
Organize the potential causes to show relationships
- Brainstorm: Brainstorming is a method for generating a large number of creative ideas in a short period of time.
- 5 Whys: It is a simple tool to ask “Why” until we can’t ask “Why” again. 5 is a good rule of thumb (of course arbitrary). By often querying “Why”, we can quickly reach the underlying causes of a problem.
- Fishbone Diagram: It is a pictorial diagram showing possible causes (process inputs) for a given effect (process outputs). In other words, it is a visual representation to find out the cause(s) of a specific problem.
- Fault Tree Diagram: Fault tree analysis (FTA) is a graphical tool to explore the causes of system-level failures. It uses boolean logic to combine a series of lower-level events. It is basically a top-down approach to identify the component level failures (basic event) that cause the system level failure (top event).
- Affinity Diagram: An affinity diagram is a good technique for identifying & displaying potential root causes for unfamiliar problems.
- Tree Diagram: A Tree diagram helps you break down big concepts into progressively greater detail. The idea here is to systematically break down a concept into its constituent pieces.
- Interrelationship Diagram: An interrelationship digraph (aka network diagram) helps you see relations and influences between several concepts. You can also use it to identify critical issues and key drivers of a problem.
- FMEA: Failure Mode Effects Analysis (FMEA) is a tool that helps us anticipate what might go wrong with a product or process.
Prioritize final list
Put the diagram of the current process steps, defined outputs & the factors influencing those outputs, and a table listing the process analysis results. Include all data sources used, how data was collected, and the tools used in analyzing the data (hypothesis testing). Use this to prioritize the final Potential Cause list.
Data Analysis & Identify the Root Cause
After the six sigma team identifies the Potential Cause list, it is required to determine its true root cause. This is where we use various methods and mathematical tools to verify our assumptions. We can also use advanced techniques to compare data against each other and even to make predictions.
Mathematical Tools
Central Limit Theorem: The Central Limit Theorem states that the distribution of the sample means approaches normal regardless of the shape of the parent population.
Distribution Types: Data distribution is a function that specifies all possible values for a variable. It also quantifies the relative frequency (probability of how often they occur). It’s important to determine the kind of distribution of that population. It helps to choose the correct statistical methods when analyzing it.
Continuous distribution
A continuous distribution containing infinite (variable) data points that may be displayed on a continuous measurement scale.
- Normal Probability: It is a symmetrical bell shape curve with higher frequency (probability density) around the central value. The frequency sharply decreases as values are away from the central value on either side.
- Lognormal Distribution: A continuous random variable x follows a lognormal distribution if its natural logarithm, ln(x) follows a normal distribution.
- F Distribution: The F distribution extensively use to test for equality of variances between two normal populations
- Chi-Square: The chi-square distribution results when independent variables with standard normal distribution are squared and summed.
- Exponential Distribution: The exponential distribution is the probability distribution of the widely used continuous distributions. Often used to model items with a constant failure rate.
- Student’s t Distribution: t distribution or student’s t distribution is a bell shape probability distribution, symmetrical about its mean. Also, see Paired t-Test and Two-sample t-test
Discrete Distributions
A discrete distribution resulting from countable data that has a finite number of possible values. Furthermore, discrete distributions can be reported in tables, and the respective values of the random variable are countable. Ex: rolling dice, choosing a number of heads, etc.
- Binomial Probability Distribution: The binomial distribution measures the probability of the number of successes or failure outcomes in an experiment on each try.
- Poisson Distribution: The Poisson distribution is the discrete probability distribution that measures the likelihood of several events occurring in a given time period when the events occur one after another in time in a well-defined manner.
- Hypergeometric Distribution: Hypergeometric distribution is a discrete distribution that measures the probability of a specified number of successes in (n) trials, without replacement, from a relatively large population (N). In other words, sampling without replacement.
Odd distribution
- Analyzing Bivariate Data: bivariate distribution is a probability of a certain event occurring in case two independent random variables exist. It may be a continuous or discrete distribution.
- Bi-modal: A bi-modal distribution that has two modes. In other words, two outcomes are most likely to compare the outcomes of their region.
Hypothesis Testing
Hypothesis Testing is a key procedure in inferential statistics to make statistical decisions using experimental data. It is basically an assumption that we make about the population parameter. There are two basic types of errors that can occur in hypothesis testing:
- Type A or 1 Error: The null hypothesis is correct but rejected incorrectly.
- Type B or 2 Error: The null hypothesis is incorrect, but is not rejected.
See also Hypothesis testing terminology
ANOVA: Analysis of Variance (ANOVA) is a parametric statistical technique to compare the data sets. It is similar to techniques such as t-test and z-test, to compare means and also the relative variance between them.
- One-way ANOVA: is a statistical method to compare the means of two or more populations
- Two-way ANOVA: testing the equality of populations means when the classification of treatments is by two categorical (independent) variables or factors.
Regression Analysis: Regression Analysis is a way of estimating the relationships between different variables by examining the behavior of the system.
Linear Regression: Linear regression is a statistical technique to estimate the mathematical relationship between a dependent variable and an independent variable.
Design of Experiments (DOE)
Design of Experiments aims to establish optimal process performance by finding the right settings for key process input variables. It is a way to intelligently form frameworks to decide which course of action you might take. See DOE terminology here.
- Factorial Designs: Full Factorial Design leads to experiments where at least one trial is included for all possible combinations of factors and levels.
- Fractional Factorial Designs: Because full factorial design experiments are often time- and cost-prohibitive when a number of treatment factors are involved, many people choose to use partial or fractional factorial designs.
- Taguchi Loss Function Robust approach in design is a key aspect as it produces reliable design both during manufacturing and also during product use.
- Evolutionary Operations (EVOP): The basic purpose of the evolutionary operations methodology (EVOP) is to improve a process through systematic changes in the operating conditions of a given set of factors.
- Latin Square: Latin square design is a fractional factorial experiment that requires less experimentation to determine the main treatment results.
- Graeco-Latin Square Design: Graeco-Latin square design is similar to Latin square design, but in some designs where the experimenter needs to block in the three directions. It is also useful to eliminate more than two sources of variability in an experiment.
- Hyper-Graeco-Latin Square Design: A Hyper-Graeco-Latin Square design is to study of treatments with more than three blocking factors.
Analyze Phase of DMAIC Deliverables
- Detailed process map
- Identify value and non value activities
- List of potential causes
- Data Analysis and results
- “Vital few” x’s
Analyze Phase (DMAIC) Videos
When you’re ready, there are a few ways I can help:
First, join 30,000+ other Six Sigma professionals by subscribing to my email newsletter. A short read every Monday to start your work week off correctly. Always free.
—
If you’re looking to pass your Six Sigma Green Belt or Black Belt exams, I’d recommend starting with my affordable study guide:
1)→ 🟢Pass Your Six Sigma Green Belt
2)→ ⚫Pass Your Six Sigma Black Belt
You’ve spent so much effort learning Lean Six Sigma. Why leave passing your certification exam up to chance? This comprehensive study guide offers 1,000+ exam-like questions for Green Belts (2,000+ for Black Belts) with full answer walkthroughs, access to instructors, detailed study material, and more.

Comments (2)
there’s a lot to Analyze phase. you can get 1000 questions just from here. taking a break here at the “Organize the potential causes to show relationships”
Thanks, Ted. This is very detailed.
You’re absolutely right. There’s a lot of depth in the Analyze phase of DMAIC, and organizing potential causes to show relationships is a key step. Tools like fishbone diagrams (Ishikawa), cause-and-effect matrices, and affinity diagrams really shine here, helping you visually map out complex interdependencies and prioritize what to investigate further.
I’m glad you found the content detailed and useful!
Keep up the great work, Sharon, and feel free to reach out if you need help digging into any specific tools or techniques!