A bimodal distribution has two modes. In other words, the outcome of two processes with different distributions are shown together in one set of data. It is also known as double-peaked distribution. For example, data distribution of two production shift data in a manufacturing plant.
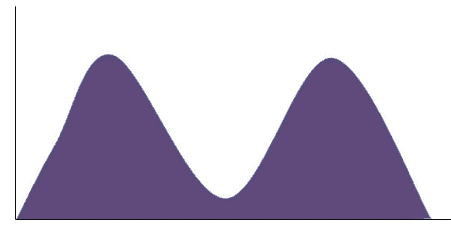
The Normal Distribution is an extremely important continuous probability distribution. It is symmetric about the mean, and the histogram fits a bell curve that has only one peak. In contrast, the bimodal distribution will have two peaks. Values in bimodal distributions cluster at each peak, which will increase first and then decrease. In other words, the two peaks in this distribution represent the two local maximums.
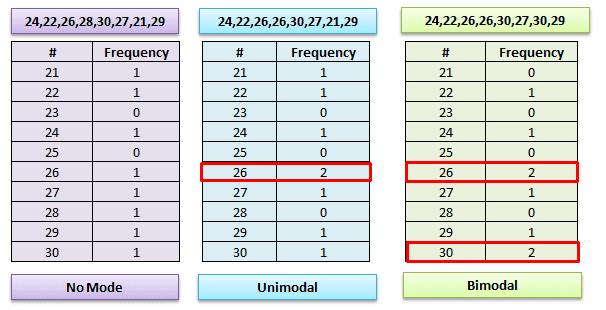
Types of modes
Data distribution is a function that prints all possible values for a variable and counts the relative frequency (probability of how often they occur).
The term mode refers to the value that occurs most often in the data set. Sometimes the data may not have any repeated or multiple numbers; then, it is a zero mode. Similarly, if the data has only one number in the frequency table, it is a unimodal distribution.
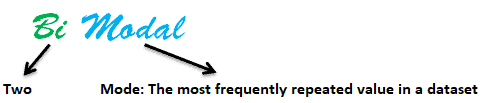
Bi-modal means “two modes” in the data distribution. For example, the data distribution of cook times for fajita recipes might have two modes: chicken and steak. A bi-modal distribution means that there are “two things” impacting the process. If the data set has more than two modes, it is an example of multimodal data distribution.
What is the Significance of a Bimodal distribution?
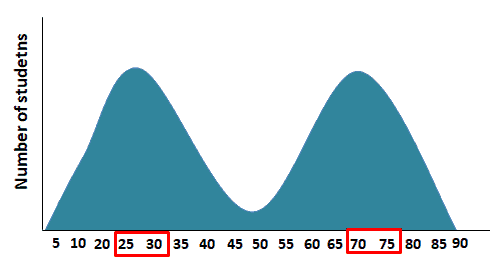
The bimodal distribution indicates there are two separate and independent peaks in the population data. For example, students test scores may follow a normal distribution. However, sometimes scores fall into bimodal distribution with one group of students getting scores between 70 to 75 marks out of 100 and another group of students getting scores between 25 to 30 marks. Reviewing the two different data groups will help the teacher to determine the reason for variations in the test scores of the two groups.
Important Bimodal Distribution Videos
Six Sigma Green Questions
Question: When analyzing sample data a Belt may experience a Bimodal Distribution with each mode displaying Normal Distribution. This could be caused by _________________________ .
(a) Two different machines being read.
(b) Two operators on different shifts.
(c) Two suppliers’ parts being used.
(d) All these are correct answers.
Answer:
D: All of these answers are correct. If you see a bimodal distribution, you are most likely seeing a depiction of 2 different processes. 2 machines, supplier parts, operators, and shifts could all ultimately be 2 or more distinct processes. See Bimodal.
