Affinity Diagrams are used to reduce larger processes to a few key steps. Possibly invented by Jiro Kawakita and thus sometimes referred to as the K-J method, an affinity diagram is a good technique for identifying & displaying potential root causes for unfamiliar problems.
Very similar to a cause-and-effect diagram, in that brainstormed ideas are segregated into categories used to organize facts and data on an unfamiliar subject. Affinity diagrams help you organize ideas into meaningful categories by recognizing common groupings. This method helps you reduce large amounts of data into a smaller set.
For example, if you send out a survey to a large team asking for ideas on how to improve the team, you’ll get as many unique ideas as you have people. But, if you group submissions into themes, you’ll have a great list of groupings. This allows you to set strategy higher rather than trying to attack each item individually.
The affinity diagram requires the least amount of preliminary knowledge compared to other management tools. Matrix diagrams, prioritization matrices, and activity network diagrams all require significant prior knowledge.
How to Create an Affinity Diagram?
Step 1: Gather Ideas
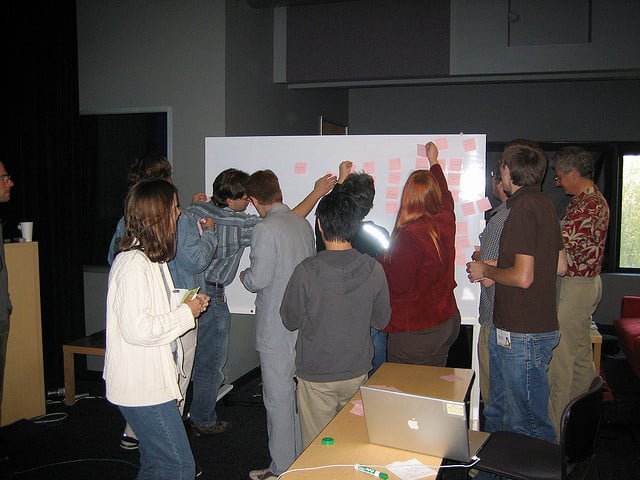
Quietly, individually, the team gathers a bunch of ideas. It could be on Post-it notes or in private survey results. The idea is that no one team member influences the others, as opposed to brainstorming.
Ex. A team returns from Six Sigma for Process Owner training. They think the ideas have merit. But they are concerned that their organization’s culture will put up too many roadblocks for them to bring the ideas to fruition.
The team leader, a Six Sigma Black Belt, gets the entire team into a room, buys them pizza, hands them sticky notes, and asks them to write down their concerns on a sticky and leave it on the board.
Be sure just to get all of the ideas on the board first. Don’t start categorizing them until idea generation is complete. If you do, you risk adding bias and marginalizing some of the participant’s ideas.
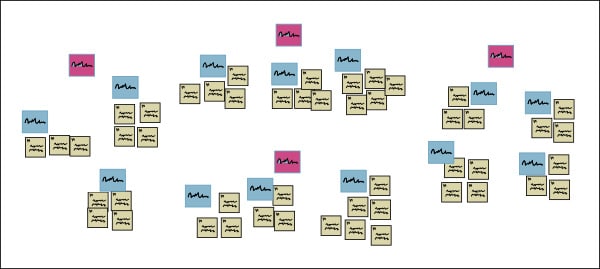
Step 2: Organize
Now we organize the ideas into large groupings.
Feedback like ‘Our accounting systems can’t handle data in a process-centric way’ sounds a lot like ‘No way to get cost measures.’
‘Individuals are not rewarded for performance’ sounds similar to ‘processing associates judged on call handle time, not customer satisfaction.’
Group all the ones that sound similar until you get a critical mass.
Step 3: Label groupings
Put Affinity titles on the groupings. You have to call them something, right?!
Step 4: Create an action plan
Everyone forgets this part! Use the affinities to create workable projects. And done! You have created an affinity diagram.
Affinity Diagram Videos
When you’re ready, there are a few ways I can help:
First, join 30,000+ other Six Sigma professionals by subscribing to my email newsletter. A short read every Monday to start your work week off correctly. Always free.
—
If you’re looking to pass your Six Sigma Green Belt or Black Belt exams, I’d recommend starting with my affordable study guide:
1)→ 🟢Pass Your Six Sigma Green Belt
2)→ ⚫Pass Your Six Sigma Black Belt
You’ve spent so much effort learning Lean Six Sigma. Why leave passing your certification exam up to chance? This comprehensive study guide offers 1,000+ exam-like questions for Green Belts (2,000+ for Black Belts) with full answer walkthroughs, access to instructors, detailed study material, and more.

Comments (4)
Awesome practical explanation
Glad it was helpful!
KIS
Keep It Simple! Absolutely!!