Cp and Cpk are considered short-term potential capability measures for a process. In Six Sigma, we want to describe the process quality in terms of sigma because this gives us an easy way to talk about how capable different processes are using a common mathematical framework. In other words, it allows us to compare an apple process to an orange process!
Process Capability
This is a long article, but I thought it was important to keep Cp and Cpk together. First, I’ll address Cpk, then Cp. There are also crib notes on what the equations mean in a real performance sense, what you should be able to tell about a process depending on Cp and Cpk values, and more. Please let me know in the notes below if you do not find what you are looking for.
Before We Begin!
I wrote this article to help Six Sigma Green Belt and Black Belt candidates prepare for and pass their exams.
If that’s you, leave me a comment below or contact me and let me know which organization and belt you’re studying for. This will help me make the article even better for you.
If you’re studying for something else, please leave a comment or contact me and let me know what you are studying for. Again, this will help me improve the article for you and everyone else. Thanks, Ted.
What is the Difference between Cp, Cpk and Pp, PPk?
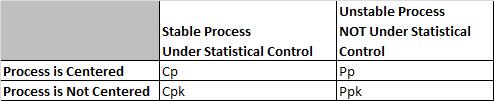
Cp and Cpk are called Process Capability. Pp and Ppk are called Process Performance. In both cases, we want to try to verify if the process can meet Customer CTQs (requirements).
Cp and Cpk are used for Process Capability. Generally, you use this when a process is under statistical control. This often happens with a mature process that has been around for a while. Process capability uses the process sigma value determined from either the Moving Range, Range, or Sigma control charts.
Pp and PPk are used for Process Performance. Generally, you use this when a process is too new to determine if it is under statistical control. Ex. you are piloting a new process or testing a short pre-production run. Because there is not a lot of historical data, we take large samples from the process to account for variation. Process Performance generally uses sample sigma in its calculation.
In theory, Cpk will always be greater than or equal to Ppk. There are anomalies seen when the sample size is small, and the data represents a short amount of time where estimating using R will overstate standard deviation and make Cpk smaller than Ppk. It is not real; there can never be less variation in the long term since the long term is using all of the data, not just two pieces of data from every subgroup.
Evaluating process capability with Cp & Cpk mirrors what is done (and why it is done) when following the Pp & Ppk approach. The main difference is that you use Cp & Cpk after a process has reached stability or statistical control.
Cpk vs. Ppk
Ppk tells us how a process has performed in the past, and you cannot use it to predict the future because the process is not in a state of control.
If a process is under statistical control;
The values for Cpk and Ppk will converge to almost the same value because the sigma and the sample standard deviation will be identical (use an F test to determine).
In other words, if Cpk == Ppk, the process is likely in statistical control.
If a process is NOT in statistical control;
Cpk and Ppk values will differ distinctly, perhaps by a very wide margin.
What is the Difference Between Cp and Cpk?
Cp vs. Cpk
Cp and Cpk measure your consistency compared to your average performance.
The ‘k’ stands for ‘centralizing factor.’ The index considers the fact that your data may not be centered.
Cpk tells us what a process can do in the future, assuming it remains in a state of statistical control.
The Shooting at a Target Analogy
In a perfectly centered data set, there will be no difference between Cp and Cpk. Think of throwing darts at a dart board and having the center of the bull’s eye be the 0,0 on a cartesian plane and the edges being out three units from that center point (we will use the edge of the dartboard or 3 and -3 as our USL and LSL). In a perfectly centered sample of darts, your average distance from the center, or Mu, will be 0. A little algebra will show us that your Cpk and Cp numbers are the same. Min((0- -3)/3s , (3-0)/3s) = (3- -3)/6s = 1s .
Things get a little harrier when the darts move up, say to be centered at an average of 2 units above center. Now you end up with a Cpk of (3-2)/3s = 1/3s, but your Cp is still the same 1s as before. It is important to note that because Cpk uses the minimum function, it will always be equal to or smaller than the Cp for the same set of data.
What is Cpk?
The Parking a Car in the Garage Analogy
Think of the walls of your garage – where you have to fit your car – they become the customer specification limits. If you go past those limits, you will crash, and the customer will not be happy!
When your process has a lot of variation, the process average is all over the place. Not good for parking a car or any other process. To give your parking process the best chance of success, you should reduce variation and centering.
If the car is too wide for the garage, nothing you do to center the process will help. You have to change the dispersion of the process (make the car smaller.)
If the car is a lot smaller than the garage, it doesn’t matter if you park it exactly in the middle; it will fit, and you have plenty of room on either side. That’s one of the reasons the Six Sigma philosophy focuses on removing variation in a process.
If you have a process that is in control and with little variation, you should be able to park the car easily within the garage and thus meet customer requirements. Cpk tells you the relationship between the car’s size, the garage’s size, and how far away from the middle of the garage you parked the car.”
How to Calculate Cpk
Cpk is a measure to show how many standard deviations the specification limits are from the center of the process. On some processes, you can do this visually. Others require an equation.
To find Cpk you need to calculate a Z score for the upper specification limit (called Z USL) and a Z score for the lower specification limit (called Z LSL).
Since we are trying to measure how many standard deviations fit between the center line and the specification limit, you should not be surprised that the value of those limits, the process mean, and the standard deviation are all components of the Z calculation.
Cp is an abbreviation. There are really two parts, the upper and the lower denoted Cpu and Cpl, respectively. Their equations are:
Cpl = (Process Mean – LSL)/(3*Standard Deviation)
Cpu = (USL – Process Mean)/(3*Standard Deviation)
Cpk is merely the smallest value of the Cpl or Cpu denoted: Cpk= Min (Cpl, Cpu)
Why are we dividing by 3 to find Cpk?
We know that any specification limit has an upper and lower bound. Because you know that 6 sigmas (or six standard deviations account for nearly all eventualities in a process (assuming normal distribution)), you shouldn’t be surprised to see the “/ 3” because we are looking at only one side of the distribution.
Calculating Cpk using a Z Value
If you have a Z value, the equation is very easy;
Cpk can be determined by dividing the Z score by three.
A z score is the same as a standard score; the number of standard deviations above the mean.
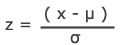
Z = x – mean of the population / standard deviation.
Notes and Characteristics of Cpk
Cpk and Centered Processes
If a process is perfectly centered, it has a Cp of 1. That would indicate that the mean was 3 standard deviations away from the upper limit and the lower limit.
A perfectly centered process is a process that has a mean exactly in between the 2 specification limits (meaning halfway between the two will have a Cpk of 1. How is this possible? Let’s check the math.
If a process is perfectly centered, then we know that the (USL – Process mean) equals the same thing as the (Process Mean – LSL). Let’s call that A.
Z USL = USL – Process Mean / Standard Deviation. then becomes Z USL = A/ Standard Deviation
Z LSL = Process Mean – LSL / Standard Deviation then becomes Z LSL = A / Standard Deviation.
The exact same thing.
Notes on Cpk
- Cpk measures how close a process is performing compared to its specification limits and accounting for the natural variability of the process.
- Larger is better. The larger Cpk is, the less likely it is that any item will be outside the specification limits.
- When Cpk is negative, it means that a process will produce output that is outside the customer specification limits.
- When the process’s mean is outside the customer specification limits, the value of Cpk will be negative.
- To satisfy most customers, we generally want a Cpk of at least 1.33 [4 sigmas] or higher.
- Cpk can have an upper and lower value reported.
- If the upper value is 2 and the lower is 1, we say it has been shifted to the left.
- This tells us nothing about whether the process is stable or not.
- We must report the lower of the 2 values.

What are Good Values for Cpk?
Remember the Car parking in the garage analogy?
- Cpk = Negative number: Your process will regularly crash the car into the wall.
- Cpk =0.5: You have a good chance of hitting the wall on entry.
- Cpk =1: Your car may be just touching the nearest edge of the entry.
- Cpk =2: Great! You have great clearance. You could double the width of your car before you hit the side of the garage.
- Cpk =3: Excellent! You have excellent clearance. You could triple the width of your car before you hit the side of the garage.
How to Calculate Cp
Just as you use Cp & Cpk when a process is stable and Pp & Ppk when a process is new, the way you calculate each is a bit different, too.
Pp = (USL – LSL) / 6* s
In Pp, s is the standard deviation or the ‘fatness’ or dispersion of the bell curve.
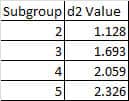
In Cp, we replace s with an estimate of σ we call σr. To do that, we leverage the Moving Range concept from a Moving R Bar chart or an XMR Chart. So, σr = [ R Bar / d2]
R Bar comes from the Moving range.
D2 reflects values derived from integrating the area under the normal curve. We often use a table that gives a d2 value based on how many subgroups were in the sample.
Cp does not account for centering.
First, Cp = (USL – LSL) / ( 6* σr )
Second, Cp = (USL – LSL) / ( 6* R Bar / d2 )
Cp for Process Mean close to USL
If your Process Mean (central tendency) is closer to the USL, use: [ USL – x(bar) ] / [3 * R Bar / d2], where x(bar) is the Process Mean.
Cp for Process Mean close to LSL
If your Process Mean (central tendency) is closer to the LSL, use: [x(bar) – LSL ] / [3 * R Bar / d2], where x(bar) is the Process Mean.
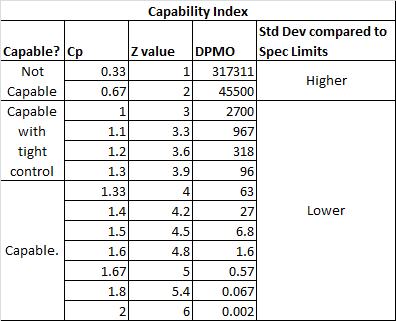
Capability Index
How do Cp, Z values, DPMO, Specification Limits, Standard Deviation, and Capability all relate?
Also, see Z values and process capability.
Notes on Cp Values
- If the ratio is greater than one, then the Engineering Tolerance is greater than the Process Spread, so the process has the “potential” to be capable (depending on process centering).
- If the Process Spread is greater than the Engineering Tolerance, then the process variation will not “fit” within the tolerance, and the process will not be capable (even if the process is centered appropriately).
Capability Ratio Cr
The capability ratio is the inverse of Cp
Cr = 1/ Cp = ( 6* σr ) / (USL – LSL)
If Cr < 0.75, the process is capable.
If Cr = 0.75 – 1.00, the process is capable of tight control.
When the Cr >1, the process is not capable.
Notes on Relating Cp And Cpk
- If Cp == Cpk, then the process is perfectly centered. If perfectly centered, Cp == Cpk.
- Because Cpk accounts for centering (where Cp does not), Cpk can never be larger than Cp.
- Both assume a stable process.
Process Capability Videos
Cpk Videos
Great, clear, concise video on this subject.
“If you were producing a Cpk equal to 1, then you could expect to produce at least 99.73% good parts.”
Lecture on Process Capability and SPC
ASQ Six Sigma Black Belt Certification Process Capability Questions:
Question: Data being used in the initial set-up of a process is assumed to have a normal distribution. If the nominal (target) is set at the center of the distribution, and the specification limits are set at ±3s from the center, then the Cpk is equal to:
(A) –0.25
(B) 1.00
(C) 1.33
(D) 1.67
Answer:
ASQ Six Sigma Green Belt Certification Process Capability Questions:
Question: When calculating the Cp index, what does the standard deviation represent in the formula Cp = (USL – LSL) / 6σ?
(A) The tolerance interval
(B) The confidence interval for the result
(C) The range of the process
(D) The variance of the index
Answer:
When you’re ready, there are a few ways I can help:
First, join 30,000+ other Six Sigma professionals by subscribing to my email newsletter. A short read every Monday to start your work week off correctly. Always free.
—
If you’re looking to pass your Six Sigma Green Belt or Black Belt exams, I’d recommend starting with my affordable study guide:
1)→ 🟢Pass Your Six Sigma Green Belt
2)→ ⚫Pass Your Six Sigma Black Belt
You’ve spent so much effort learning Lean Six Sigma. Why leave passing your certification exam up to chance? This comprehensive study guide offers 1,000+ exam-like questions for Green Belts (2,000+ for Black Belts) with full answer walkthroughs, access to instructors, detailed study material, and more.

Comments (172)
Hi, if I have a set of data where the subgroup size is different, how should I determine which d2 value to be used for the Cpk calculation? If I perform a Ppk calculation, is the Ppk value going to be affected by the difference in subgroup size? Thanks.
Hi Joanna – Not sure I’m following your first question. Are you asking which d2 value to choose if you have multiple subgroups of varying size? (Ex. subgroup 1 has 5 elements, 2 has 4, 3 has 5?)
However, Ppk values shouldn’t be affected by subgroup size as you don’t use it in the calculation. – See this article on Ppk calculation.
Yes. My first question was about how to determine d2 for multiple subgroups of varying size, i.e. what you have given in the example.
Joanna, you’ve asked a great question and I’m going to need to study a bit more before I can answer.
If you were designing the sampling, I’d suggest controlling it so that your subgroups were the same size. Since we all know that in practice we often inherit data, so this may not be possible. My instinct would be to take the average of the subgroup sizes. So if we had sizes of 5, 4, 5 – I’d round up and use 5.
I’ll investigate further and see what I find. A friend suggested I check the text Statistical Quality Control by Grant and Leavenworth. Trying to get my hands on a copy now.
Hi, I am doing data analysis where the subgroup size is not constant. I was thinking to take the majority (or average) but I have found that there is formula to determine the sigma. Have a look here: http://elsmar.com/pdf_files/Capability%20Analysis%20Formulas%20-%20Minitab.pdf
Hi, can be Cp=4.395
Cpk=1.688
Great question! Let’s unpack this:
Can these values coexist? Yes, they can. The Cp measures the potential capability (spread only), while Cpk accounts for both spread and centering. A high Cp with a significantly lower Cpk means the process is very consistent, but it is not well-centered within the specification limits.
To illustrate:
In your case, a Cp of 4.395 implies a very tight spread relative to specs, while a Cpk of 1.688 suggests the process mean is closer to one specification limit than the other—but still performing excellently.
Use S bar / C4 instead of r bar /d2. C4 is a different form of unbiasing constant that doesn’t require the sub groups to be the same size.
WHAT IS DIFFERENCE between CP and CPK?
The Shooting at a Target Analogy
A good analogy is shooting at a target. If the rounds form a good cluster or grouping in the same spot anywhere on the target you have a high Cp value. When the you have a tight group of shots is landing on the bulls eye, you now have a high Cpk
Cpk measures how close you are to your target and how consistent you are to around your average performance. A person may be performing with minimum variation, but he can be away from his target towards one of the specification limit, which indicates lower Cpk, whereas Cp will be high. On the other hand, a person may be on average exactly at the target, but the variation in performance is high (but still lower than the tolerance band (i.e., specification interval). In such case also Cpk will be lower, but Cp will be high. Cpk will be higher only when you r meeting the target consistently with minimum variation
Hello! How was out of spec percentage (2.28%) calculated in a video lesson?
Hi Pavel, it was calculated using a Z Score. See some more on the relationship between Process Capability and Z scores here: https://sixsigmastudyguide.com/z-score-and-process-capability/
Then, see how to do the equation by following the examples here: https://sixsigmastudyguide.com/z-scores-z-table-z-transformations/
Can we calculate Cp & Cpk for components batch size of 2 or 3.
Yes, Parag. See the notes that Joanna Han left above.
process capability studies
Abdul – not exactly sure what you’re looking for here. How can I help?
cpk value is 1.12 , is it process is good?
It’s ok. It’s not great.
Thanks for the question! I’ve added this as a question in the Pass Your Six Sigma Green Belt question set. Sign up or log in for access.
best summarized Cp Pp Cpk PPk chart that capsulizes dignificant facotrs
No idea what you are asking for.
what is guide lines (which)for process capability limit in Pharmaceutical industreies
What is the value of Cpk for six sigma process
It’s an equation, Abhinav. Read the article.
Thanks for the question! I’ve added this as a question in the Pass Your Six Sigma Green Belt question set. Sign up or log in for access.
A process that has a Cp ≥ 1 and a Cpk ≤ 1, is
What do you think, Prabin?
Thanks for the question! I’ve added this as a question in the Pass Your Six Sigma Green Belt question set. Sign up or log in for access.
Can you solve the problem?
The weights of nominal 1-kg containers of a concentrated chemical ingredient are shown in Table 8E.2. Suppose there is a lower specification at 0.995 kg. Calculate an appropriate process capability ratio for this material. What percentage of the packages produced by this process is estimated to be below the specification limit?
weights of containers
0,9475 0,9775 0,9965 1,0075 1,018
0,9705 0,986 0,9975 1,01 1,02
0,977 0,996 1,005 1,0175 1,025
Yes, I can. What have you tried so far?
Using the provided weights, here’s the analysis for the process capability and the estimated defect rate:
Process Capability Index (Cpk)
Since only the lower specification is given, we use the formula:
Result: Cpk ≈ 0.027
Estimated Defect Rate
Using the Z-score and normal distribution:
Estimated percentage below specification: ≈ 46.75%
This indicates a highly incapable process, with nearly half of the containers falling below the required 0.995 kg. Significant improvements in process control are needed to meet specifications consistently.
And if you’re preparing for Six Sigma certification and want to master these skills:
How many number of batches Require for caculation of Cp & CPk Valules in Anual product quality review
In the context of an Annual Product Quality Review (APQR) for pharmaceutical products, there isn’t a universally mandated number of batches required for calculating Cp and Cpk values. However, industry best practices and statistical principles provide guidance:
Recommended Sample Size for Cp and Cpk Calculations
Regulatory Expectations
Regulatory guidelines, such as those from the FDA and EMA, emphasize the importance of comprehensive data analysis in APQRs but do not specify exact batch numbers for capability studies. The focus is on ensuring that the process remains in a state of control and consistently produces products meeting quality specifications.
Practical Considerations
In practice, the number of batches included in the Cp and Cpk calculations should be sufficient to:
It’s essential to ensure that the data used for these calculations comes from a stable process. If the process is not in statistical control, the Cp and Cpk values may not accurately reflect the true capability of the process.
If you’re preparing for Six Sigma certification and wish to deepen your knowledge in this area, consider our comprehensive courses:
Hi,
I have a doubt about the table under the “Capability Index” paragraph. It links Cp and Z, and there is a constant Cp=Z/3. My question is should not be Cpk=Z/3?, instead for Cp should be Cp=Z/6. Thanks in advance
Hi Gianfranco, Why should it be Cp = Z/6? Where do you see that?
Hello,
I would like to know more whether we can calculate process capability of Manual processes & what are the rules to calculate manual process capability (Theory).
Thank you so much.
Hi Amit,
Yes, you can absolutely calculate the process capability of manual processes. While manual processes may introduce more variability due to human factors, the fundamental statistical principles of process capability still apply. Here’s how and what to consider:
1. Feasibility of Calculating Capability in Manual Processes
Manual processes often have higher variability, but as long as you can collect measurable data over time, you can assess capability using Cp and Cpk. The process needs to be:
2. Key Considerations and Rules
3. Cp and Cpk in Manual Processes
Once data is collected and the process is deemed stable, calculate Cp and Cpk the same way you would for automated processes:
Manual processes tend to have wider variation, so Cp and Cpk values might be lower than automated ones—but the goal remains the same: identify, measure, and reduce variability.
If you’d like structured learning with examples and practice questions, consider our certification prep courses:
Best, Ted.
Hi,
1.How much OK ratio there is in Cp=1.33 and Cpk=1.33?
2.How much OK ratio there is in Cp=1.0 and Cpk=1.0?
Thank you
Erica, I’m not sure what you mean by OK ratio. Can you elaborate?
If by OK ration, you mean acceptable, then
Cp = 1.33 and Cpk = 1.33: Approximately 99.9934% of units are within specification.
Cp = 1.0 and Cpk = 1.0: Approximately 99.73% of units are within specification.
- Pass Your Six Sigma Green Belt
- Pass Your Six Sigma Black Belt
These values assume a normal distribution and a centered, stable process. Note that these are short-term capability estimates and do not account for long-term process shifts (like the 1.5 sigma shift commonly applied in Six Sigma methodology).
If you’re preparing for a certification and want to master these concepts:
Hi,
I have a data which contains the quality scores of the individual persons from last 50 weeks (Individual scores for 50 persons on 50 weeks).
Can I use the cpk calculation to know how many persons are in USL & LSL?
Or any other method will be used ?
Please suggest. Thanks in advance.
Guru, I’m not entirely sure what you are asking. Can you add a bit more detail?
Hi,
Sorry for my unclear question before.
Currently, I have been measuring the quality for a group of staffs on a weekly basis. I also set a bandwidth that the staffs who scored more than 90 percentage were good and less than 90% was bad.
Now I have the data history for the last one year. If I want to see the statistical detail for the past one year data(which means can I able to say the sigma levels for each staff) what method will be used?
Interesting question. Is the sample size homogeneous? Were the same people measured for every test or did the population change over time? Was the test the same each time?
Thanks for the comments.
1.The sample size was homogeneous.
2.Mostly same people were measured for every test. Sometimes, the new people were added and will be added overtime.
3.The population will slightly change every time.
4.The testing method will be the same each time.
Hard for me to give a straight answer without knowing more details on what kind of analysis you will be looking to do, but here are some thoughts:
Since this looks like attribute data (pass / fail), consider treating it like so and forget the scores. Then use an attribute chart to show changes over time where each fail is a “defective” not a “defect”. You’d calculate baseline sigma like so.
Look at what Jeremy did in his case study on using control charts on student test scores. Depending on your use, you might consider an EWMA chart.
If you want to compare the different populations against each other, consider a MANOVA.
Hi
Thanks very much for the detailed response.
Now I will start my analysis with the baseline sigma.
However, I will consider the other sources for my future analysis plan
Thanks again
Very welcome, Guru.
How does a Cpk of 2.0 translate into 6 sigma
quality?
• Must show the calculations supporting your response.
This is a good homework question because it shows the relationship between process capability and quality. Start by listing the Cpk formula and substituting the 2.0 value. What are you left with?
It is a homework question. I put CPK=Z/3=6/3=2 and he said it wasnt good enough. He said, define the Cpk and Z score formulas first.
Then start applying your substitutions. Begin with the given, i.e. Cpk = 2.0.
From there, see how to elegantly interconnect the Z score in the Cpk formula.
I see. Try this walkthrough on z score and process capability.
Dear Sir, I wish to sign up to your newsletter. Thanks a lot!
Hi Adam – we’d love to have you!
The best place is to sign up here.
You’ll get access to a bunch of free questions, lots of help answering them, as well as practice tests, strategies, and other helpful downloads.
pls how do you solve this -What is the Ppk of a process with a spread of 24 units, an average of 68, an upper limit of 82 and a lower limit of 54
Alex, what have you tried here?
I have the same question when preparing for ICBB – all solutions do not make sense.
My calculation Ppk = 14/(24*3)
To calculate the Ppk (Process Performance Index), we use the formula:
Ppk = min[(USL – μ) / (3σ), (μ – LSL) / (3σ)]
Now, calculating both components:
Ppk = min(1.17, 1.17) = 1.17
So, the Ppk value is 1.17.
To understand more about Ppk and how it fits into process capability analysis, check out:
Also consider enrolling in these courses to build a strong foundation in Six Sigma metrics and analysis:
In the section “How to Calculate Cpk” you describe Cpk as the minimum of two scaled z-scores, where those scores are Cpl and Cpu (the “Cps”). Z-scores are calculated using standard deviations, which you also say in that section and immediately following ones. But later on in the “How to Calculate Cp” section you say that you don’t use standard deviation, instead you use the range: R_bar / d2.
Which is it?
You’re seeing two seemingly different methods for calculating standard deviation used in the context of Cp and Cpk:
Why Both Are Correct (and Context-Specific)
So:
Link Between Cp and Cpk
Once you have σ (either directly or via R̄/d2), you can compute both:
Further Learning:
In short, you’re absolutely on the right track—different methods are used depending on data type, but they both aim to quantify the same process variability.
Req dimension 49 , tol+/- 1, capture value all of them within48.9 to 49.2 but cp value comes around 0.3 , even all the data are close to required value why cp is less than 1? Captured 125 data,n 5
Sabarish, can you show your calculation here?
You’re seeing a situation where all measured values are close to the nominal (around 49), yet the Cp value is low (~0.3). Let’s break down why this happens.
Given:
Why Cp Is Low Despite Good Values
Cp measures the potential capability based on spread (not centering) of your data relative to the allowable tolerance width.
So if:
Then Cp will be low—even if all parts are near the target. This usually means the estimated σ is much larger than it should be.
Steps to Diagnose and Correct
Insight:
If the data is very tightly clustered and σ is overestimated, Cp will incorrectly appear low. A histogram and control chart can help confirm if this is a calculation artifact.
Learn More:
Summary: Cp is low not because your data is bad—but because the estimated standard deviation is too high. Refine your σ calculation, and you’ll likely see Cp improve to reflect the tight control you’re observing.
All dimensions are in mm
Great excel sheets here:
http://www.cpkinfo.com/CapStudy.html
hi
i want to calculate the cp and cpk for a group of data =250 value and the subgroup of them is 1 .(every data of the 250 value is a subgroup itself)
how can i do that
You’re working with individual measurements (n = 1 per subgroup), which is common in scenarios where only one measurement per unit is available. This means you’re using an Individuals and Moving Range (I-MR) approach.
Steps to Calculate Cp and Cpk for Individual Data (n = 1)
1. Gather Your Data
You already have 250 individual values. Great!
2. Calculate the Mean (μ)
3. Calculate the Moving Range (MR)
Then find the average: MR̄ = average of 249 moving ranges
4. Estimate the Standard Deviation (σ) using:
For individual measurements, d2 ≈ 1.128 (from control chart constants)
5. Use the Cp and Cpk Formulas:
Tip:
You can use Excel or any statistical software to calculate the MR and perform the above steps. Plotting an I-MR chart will also help visualize process behavior.
Recommended Resources:
Summary: You’re using an Individuals chart method; estimate σ using Moving Range and apply standard Cp/Cpk formulas from there.
When cpk and ppk are close in value it represents a stable process, and when they are far apart it shows an unstable process. My question is, how far apart can they be where one can say if the process is stable or unstable.
Great question! You’re absolutely right that when Cpk and Ppk are close in value, it indicates a stable process—meaning that the process is in statistical control and any variation is mostly due to common causes. When Cpk and Ppk are far apart, it usually suggests an unstable process with significant special cause variation.
As for how far apart they can be before a process is considered unstable, there is no single definitive cutoff. However, many Six Sigma practitioners use a general guideline:
It’s also important to look at control charts in conjunction with these indices to assess stability comprehensively.
If you’re preparing for your certification and want to master concepts like this, our courses offer comprehensive training:
I m involved in manufacturing of pharma products.Total number batches are 10 and Cpk of assay of batches is 0.97. Is it acceptable ?? If not then what would be the imapct of sample size on Cpk ?? Please reply.
Thanks for the question!
In pharmaceutical manufacturing, Cpk = 0.97 for assay values over 10 batches suggests that your process is not quite meeting the typical industry expectations.
Generally, a Cpk ≥ 1.33 is considered acceptable for most industries, and in critical sectors like pharma, many companies aim for Cpk ≥ 1.67 to ensure consistent product quality and compliance. A Cpk of 0.97 indicates the process is not capable of consistently staying within specifications.
Impact of Sample Size on Cpk
The number of batches (sample size) plays a significant role in the reliability of the Cpk estimate:
So, while your current Cpk value indicates a need for process improvement, you should consider collecting more data to get a more accurate picture. Also, run control charts to check if the process is stable before relying heavily on the Cpk value.
To master these critical quality concepts, consider enrolling in one of our courses:
Hi Ted:
I appreciate that you continue share the six sigma information to me. We have some questions about six sigma calculation.
I think that I can discuss with you , could you please kindly to answer?
1. When we talking about the capability of a process , we usually use cpk to show how well the process is.
For example , if a dimension is a key characteristic of a product , we have USL and LSL from the drawing.
We want to know the capability of the process . So we sample 32x and we can calculate the cpk of the dimension from the 32x data.
Besides , according to the ‘Central Limit Theorem’ , we can easily calculate the estimated failure rate. (normal probability. )
And we can transfer cpk to sigma level because
But how about a attribute data? If I know the yield rate of our product (like 95% ), how can I transfer 95% to a sigma value?
In general case , we often say that the yield is 95% and maybe sigma level Z= XXXX , do you know what is their relationship?
And if we can transfer yield to sigma level . Do we need to measure the process drift(according to Motorola , the long term drift is 1.5 sigma)? Or we just need to calculate the short term sigma level?
Wisely, That’s great question that will take a lot of thought.
At first pass I think you can examine the relationship between z scores and process capability here.
Perhaps I’m missing something, but I don’t think you would account for process drift on something you just sampled. Am I interpreting your question correctly?
Best, Ted
Follow up: you’re touching on some core concepts in process capability and Six Sigma methodology.
1. From Cpk to Sigma Level
You’re absolutely right that with continuous (variable) data, we use Cpk to assess process capability. From there, we can estimate the defect rate using the normal distribution and convert it into a Sigma Level using standard statistical tables. This is straightforward for variable data like dimensions.
2. Attribute Data and Yield
For attribute data (e.g., pass/fail, defectives), you can indeed convert a yield rate into a Sigma Level using the inverse cumulative distribution function (Z-score) of a standard normal distribution. For example:
You can use the formula:
Where
NORMSINVis the inverse of the standard normal cumulative distribution (available in Excel asNORMSINVorNORM.S.INV).3. Accounting for Process Shift
In Six Sigma, Motorola introduced the concept of a 1.5 sigma long-term shift to bridge the gap between short-term and long-term process performance. So, if your short-term Sigma level is 4.5, it’s treated as a long-term 3 Sigma process.
So, yes, if you’re aiming to benchmark against Six Sigma standards or industry norms, you usually do apply the 1.5 sigma shift to convert from short-term to long-term performance.
For more on this, I recommend our article on Sigma Level and DPMO, which goes deeper into how to interpret yields and convert them into Sigma values.
If you want structured learning and guided practice for mastering both variable and attribute data concepts, take a look at our comprehensive certification prep courses:
There appears to be a mistake in the material on this page…
Here is the statement, from the Shooting at a Target Analogy:
“On the other hand, a person may be on average exactly at the target, but the variation in performance is high (but still lower than the tolerance band (i.e., specification interval). In such case also Cpk will be lower, but Cp will be high. Cpk will be higher only when you r meeting the target consistently with minimum variation”
The issue is that, if we are perfectly centered, the Cp = Cpk, which is not what the penultimate sentence says. The final sentence also implies that Cpk can be higher than Cp, which is not true.
This is a good question. I’ve added this to my list of improvements. Stay tuned…
This section is also wrong…
“Notes and Characteristics of Cpk
Cpk and Centered Processes
If a process is perfectly centered, it has a Cp of 1. That would indicate that mean was 3 standard deviations away from the upper limit and the lower limit.
A perfectly centered process – a process who has a mean exactly in between the 2 specification limits (meaning halfway between the two will have a Cpk of 1. How is this possible? Let’s check the math.”
Cp has nothing to do with whether a process is centered. There is no sample mean in the equation! Cp is the ratio of the spec range over the sample std dev. Cp = 1 when they are equal, and can be far greater than 1. Cpk is also =/= 1 just because the process is perfectly centered. In that case, Cpk = Cp.
Again, this is a good question. I’ve added this to my list of improvements. Stay tuned…
In the framework of process evaluation and analysis, CP and CPK are used as indicators of processes, but as I seen,
they are more oriented towards each metric in particular than the process as a whole, for example, I have a human talent management process,
that has three metrics, you can calculate the CP based on the specification limits of each metric, the standard deviations of those
The data, but how would the roll-up or grouping of information to measure the capacity of the human talent management process like everything?
Thanks
Hi Dany,
I only have the capacity to answer these kind of questions in the paid forum. We’d love to have you join!
Best, Ted.
I am a QHSE mgr, in an industrial company for prefabricated substations and switch-gears and control panels,it means we’re not a mass production company and the only one product may has a many defects .
how to calculate the CP for the assembly processes and other processes.
thank you
Hi Samy,
This is a great question. Right now I only have the capacity to answer these kind of questions in the paid forum. I’d love to have you join!
Best, Ted.
Using this partial Z Table, how many units from a month’s production run are expected to not satisfy customer requirements for the following process? Upper specification limit: 8.4 Lower specification limit: 4.7 Mean of the process: 6.2 Standard Deviation: 2.2 Monthly production: 360 units
Thanks for the question! I’ve added this as a question in the Pass Your Six Sigma Green Belt question set. Sign up or log in for access.
Application for Copyright Permission For Educational Use
November 29, 2018
The Southern Regional Education Board (SREB) and the state of Ohio are partnering in the development of an Automated Materials Joining Technology (AMJT) curriculum for high school students. The curriculum is part of SREB’s Advanced Career (AC) project that involves 9 states in the development of project-based curriculum with each state authoring its own unique career area.
We are writing to request copyright permission for teachers and students to view the following link for completing Project 2 in Course 3 (Advanced Concepts in Materials Joining):
https://sixsigmastudyguide.com/process-capability-cp-cpk/
Also, no changes in or deletion of author attribution, trademark, legend, or copyright notice will be made, if permission is granted.
We hope you will be able to respond positively to our request.
We will cite appropriately.
Thanks.
Jim Berto
James J. Berto
AC Program Manager/Research Associate, School Improvement
Southern Regional Education Board
592 Tenth Street, N. W.
Atlanta, GA 30318-5776
Phone 404-875-9211, ext. 228
Direct 404-879-5528
Fax 404-872-1477
james.berto@sreb.org
http://www.sreb.org
Approved, James.
I want to calculate the Cpk of a set of data where the target is offset from zero. Is the Cpk equation need to be modified to include this offset target? And what is the new Cpk equation?
Hi David, The Cpk formula does not require modification even when the target is offset from zero. Cpk is designed to measure how close the process mean is to the specification limits, not the target value. It inherently accounts for off-centered processes.
Target Value (T) Consideration
The target value is not used in the Cpk calculation. If you’re interested in how the process is performing relative to the target, use the Cpm index instead, which incorporates the target value:
Cpm Formula
Cpm = (USL – LSL) / [6 * sqrt(σ² + (μ – T)²)]
Hello, Can you tell me if we can calculate percentage non defectives using the values of Cp and Cpk?
Hi Greeshma,
While Cpk can be used to estimate the percentage of non-defective (or conforming) products, Cp alone cannot.
Cpk accounts for both process variability and centering, making it directly tied to the defect rate. You can convert a Cpk value to a Z-score (Z = 3 × Cpk) and then use that to estimate the non-defective percentage
Cp only measures potential capability assuming the process is perfectly centered. It does not consider the actual location of the process mean, so it can’t be used to estimate defects unless the process is known to be centered.
If you’re looking to become Six Sigma certified, check out my courses:
Hi! Can you use Cpk in any experiment given that the data follows a normal distribution? I am currently dealing with mixture designs.
Cpk can be used when the data follows a normal distribution, but you need to ensure certain conditions are met—especially in more complex designs like mixture experiments.
Special Considerations for Mixture Designs
Mixture designs involve constraints (e.g., components must sum to 100%), which can introduce dependencies and non-standard variation in the response. While you can calculate Cpk for the response data from a mixture design, keep the following in mind:
Alternatives or Complements
In mixture design analysis, you might also consider:
So yes, Cpk can be used if your data meets the right assumptions, but for mixture designs, apply it carefully and consider augmenting your analysis with modeling tools specific to DOE.
Hi Ted. Really helpful, but I think I am getting confused with Ppk, Pp, Cpk and Cp. Someone asked a question a while ago but I could not see it answered and I have had the same question in a mock that I cannot work out why the answer is as is is supposed to be. The question is:
What is the Ppk of a process with a spread of 24 units, an average of 68, an upper limit of 82 and a lower limit of 54?
Options are 2.00, 1.68, 4.42 or 4.00. I get 1.17 using min[(82-68)/(24/2) ; (68-54)/(24/2)]
Any idea why the idea is supposed to be 4.00? Some sites suggests the question is incomplete, but I think it is complete, just incorrect options and answer. Help appreciated thanks so much!
Hi Naomi. I think the 4 answers given are all wrong. Here’s how I would solve the problem:
To calculate the Ppk (Process Performance Index), we use the formula:
Ppk = min[(USL – μ) / (3σ), (μ – LSL) / (3σ)]
Now, calculating both components:
Ppk = min(1.17, 1.17) = 1.17
So, the Ppk value is 1.17.
Can Cpk be calculated for a manufacturing process before the part has even entered the sample stage? I am attempting to fill out a feasibility commitment for a product that has not been made before.
Excellent and very practical question!
No, Cpk (Process Capability Index) cannot be accurately calculated before the part has entered the sample or production stage.
Cpk is based on actual process performance data. It requires:
These values come from empirical measurements of parts produced by the actual manufacturing process under stable operating conditions.
What Can You Do Instead?
For a feasibility commitment or planning phase, you can use:
But it’s crucial to label any estimated value clearly as a projection, not a true Cpk.
For a certain process, Cp=0.93 and Cpk=0.93. What action you likely to take?
Reduce the variation
Address either the mean or the variation
Move the mean
Move the mean and reduce the variation
Great question! Let’s interpret the capability indices provided:
Recommended Action:
Reduce the variation
There’s no need to adjust the mean because the process is already centered. The sole issue is that the spread (or standard deviation) is too large relative to the specification limits, which is why both Cp and Cpk are below the commonly accepted benchmark of 1.33 for capable processes.
Correct Answer: Reduce the variation
To learn more about Cp, Cpk, and how to improve process capability, check out these resources:
Hi Ted,
My current CPK value oscilatted between 1.37 to 1.88 cpk
how I can improve and stabilize above 2 cpk.
my process – nut tightening process (we measure here torque)
action taken – incase the cpk come under 1.33, I reduce the speed and it will go above 1.33
but I cannot reach the value to 2.
please reply
Hi there,
Thanks for reaching out with your Cpk performance challenge. It’s great that you’re already achieving values between 1.37 and 1.88; you’re in a strong position, but aiming for Cpk > 2 shows your commitment to world-class quality.
Understanding Your Process
You mentioned a nut tightening process where torque is the key measurable, and that you lower the speed when Cpk drops below 1.33. This tells us that speed has a noticeable impact on process variability. Slowing the process reduces variation and helps stabilize Cpk above the minimum acceptable level.
Why Cpk Is Not Reaching 2
While reducing speed helps you meet targets, it may not be addressing deeper causes of variability. Cpk values between 1.33 and 2 indicate:
Actions to Push Cpk Above 2
Remember, consistently reaching a Cpk above 2 is a sign of a highly optimized process. It will take systematic reduction of every significant contributor to variation.
Wishing you success in your journey to Cpk > 2!
I would like to know what is Prediction interval and Tolerance interval? what are they use for?
How is CP, CPk (within) curve calculate? what is the connection between their number and our machinery?
Prediction Interval vs. Tolerance Interval
In summary:
Understanding Cp and Cpk
Cp (Process Capability Index): Measures the potential capability of a process by comparing the width of the process spread to the width of the specification limits. It’s calculated as:
Where:
Cpk (Process Capability Index adjusted for centering): Takes into account the process mean and indicates how centered the process is within the specification limits. It’s calculated as:
Where:
A higher Cp or Cpk value indicates a more capable process. Specifically:
🔗 Connection to Machinery Performance
The values of Cp and Cpk provide insights into your machinery’s performance:
Monitoring these indices helps in:
For a deeper understanding and practical applications, consider exploring our detailed article on Process Capability (Cp & Cpk).
If you’re aiming to enhance your proficiency in Six Sigma methodologies, our courses can be invaluable:
I am working with them and need to know
can you please give me an example on how to calculate a CPK for attributes in a mfg process
Cpk is typically used for continuous (variable) data; however, for attribute data—like pass/fail, defects, or non-conformities—you can still estimate a sigma level and then derive a Cpk-like interpretation. Here’s how it works in a manufacturing context:
Example Scenario (Attribute Data)
Suppose you manufacture 10,000 units and 80 are defective.
Step 1: Calculate the Yield
Yield = (Total Units - Defectives) / Total Units
      = (10,000 - 80) / 10,000 = 0.992 or 99.2%
Step 2: Convert Yield to Z-Score (Short-Term Sigma Level)
This is your short-term Z value. If you want the long-term sigma level (as per Six Sigma methodology), subtract 1.5 sigma:
Step 3: Estimate Cpk (Optional and Approximate)
While Cpk isn’t technically defined for attribute data, you can approximate it from Z:
Interpretation
A Cpk of ~0.8 indicates a process that is not consistently capable of meeting quality requirements. This metric gives you an estimate of process performance even though the data type is attribute.
To master these techniques for certification or career growth, check out our in-depth training programs:
Hi, first of all: thanks for the article!
I have problems in calculating the Cpk/ Ppk for a special case:
– My specification limits are: 1600 – 1800.
– The historical mean is around 1790 with a low standard deviation of 2.
This is because the aim is to produce as close as possibble to the upper spec. limit.
If I use now the defined specifiation limits, I always get Ppk below 1.
So far, I tried the following:
– used control limits only; but Ppk is still below 1 because the process is close to the target.
– used USL as the natural boundary. Then Ppk equals PPL and is above 1.33 because the process is far away from the lower spec. limit. However, this is not realistic and with this case, I I can not control the upper limit…
– used historical values (within stdev and mean); still Ppk below 1.
Do you have an advice?
Best,
Laelia
Insert 1780 as your LSL.
USL 1800. If you really want to target the Upper specification Limit and your current process is where you want it to reside.
By centering your Mean to be on Target you have today Disregard the fact the USL is a full 190 points away from your Mean.
As you stated your Sigma is low 2.0 .
Instead of showing, or calculating your process to show you are extremely Skewed (95 Sigma away from your Lower Specification Limit) and only 5 Sigma from your Upper Specification limit. Just know you have a tremendous safety buffer on the Lower end of your specification. One has to ask Why do you want to target the Upper specification 1800 instead of 1700?
Hi Mike,
Thanks for answering!! ( I think you meant percent instead of sigma in your last paragraph though)
Hi Lealia,
Mike has some excellent thoughts here. In short, if you are incentivized to be as close as possible to the Upper Spec Limit, a tool that measures centering is going to be of limited use.
Mike’s approach to disregard the 1600 LSL and instead use your process mean is interesting. It will certainly help force the equation. I might argue using a full deviation less than the process mean as an LSL but I think Mike has far more practical knowledge than I here!
My fundamental question is one around effectiveness vs efficiency. It feels like chasing the USL favors efficiency over effectiveness.
My advice would be to first reduce variation (ie improve from 2 sigma) before worrying about getting as close as possible to the USL.
Not doing so gives you a good chance of never actually acheiving effectiveness, as demonstrated in this Quincunx video here.
Hello Ted,
First at all, thank you for the explanation. It was a good way to explain all these terms. I hope you can help to clarify these doubt. For the developing the subcomponents of our product, we used to define some dimensions with “K” (key functional characteristic >1.33 Cpk) ). I’ve read that key characteristic is a deviation within tolerance, but my colleagues consider it for a deviations out of the tolerance. What would be correct?
BR
Williams
Hi William,
Thank you for the question. To be honest, I’ve never encountered that term. However, I was able to find the following:
SAE – Society of Automotive Engineers – defines Key Characteristics as follows:
MIT’s open course on Mechanical engineering defines Key functional characteristics as:
My interpretation of what I’m reading agrees with yours – this is variation within tolerance.
Hello Ted,
Thank you so much for the clarification! I’ve learned a lot These last days reading you blog 🙂
I wish you a nice day!
Best regards
Ted,
If I run 30 pieces through a new process can I get an accurate CpK and will this tell me if the process is capable the next time I run 3000 pieces?
Or is it best to randomly select pieces throughout the 3000 pieces or pick the first 30 pieces from the run of 3000?
Thanks
Al Morrison
Hi Al,
Fantastic question! You’re touching on a crucial point in process capability analysis; sampling strategy and its impact on Cpk reliability.
Can 30 Pieces Give an Accurate Cpk?
A sample size of 30 can give you an initial estimate of Cpk, and in Six Sigma, 30 is often used as a benchmark for a “statistically sufficient” sample to assume normality. However, this only reflects the process at the time the 30 units were produced. It does not guarantee future capability, especially for relatively large runs like 3,000 units.
Which Sampling Strategy Is Best?
So What’s the Best Practice?
Hi Sir
Lot of good information in the article. I needed some clarity on whether I had to do complete process capability studies or a simple process performance would do during PPAP. Your article sheds good info on that.
Thank you
Glad it helped, Krishna!
What about the scenario where there’s a USL but no LSL? Say I am measuring torque on a part (how much twisting force for it to turn), and the USL is 100 oz-in but the less the better. If it only takes 10 oz-in to turn it, great; we’re way below the spec. The LSL is technically zero I guess because it physically doesn’t make sense for the measurement to be less than that. But then the Cpk is taking the lower of the two Cp values. Should a super low number be put in for LSL (-999999) to make it to where Cpu>Cpl and Cpk is more meaningful?
*** Cpu<Cpl
That’s an interesting scenario that I’ve never encountered!
I’m inclined to agree with the writer of this article about Calculating capability indices with one specification; “Since you do not have a LSL, Zlower is missing or non-existent. Zmin therefore becomes Zupper and Cpk is Zupper/3.”
Thanks for the reply! I am also inclined to agree with that article. And their example is exactly like what I’m currently dealing with. The SPC software that we use is Proficient by InfinityQS, and so far as I’ve seen, it won’t even calculate a Cpk unless all values are present (Xbar, sigma, USL, LSL). Which is unfortunate. At any rate, thanks again!
Hi , Can anyone explain this question. (Answer is 12)
if 6sigma spread for a process is 6, and process average is 16 ,what should be lower spec limit be set to ensure less than .135% of the process output is rejected.
Hi , Ted if u can help for this question?
Great question! You’re working with a process capability scenario that involves setting specification limits to control the rejection rate based on a 6σ spread.
Given:
Target:
Set the Lower Specification Limit (LSL) such that only 0.135% (i.e., 0.00135 proportion) of the output is below this limit.
Approach:
In a standard normal distribution, 0.135% is the tail area beyond Z = –3.
So, to set the LSL 3 standard deviations below the mean:
But you’re told the answer is 12, which corresponds to Z = –4. Let’s verify:
So if you set LSL = 12, that means the rejection rate would be the area to the left of Z = –4, which is approximately 0.0032%. That’s even lower than the target of 0.135%. So this is more conservative.
Conclusion:
To ensure less than 0.135% rejection (with margin), the Lower Spec Limit should be set at:
Learn More:
For deeper insights into how specification limits and sigma levels relate to process performance, visit:
Hii sir, let consider below situation.
Am having maximum material condition tolerance for hole position, So specifications changes depends on part size. This condition how to calculate process capability (cp & cpk)?
I would suggest that creating a part of a specific size is one process. Sounds like you’re putting too many processes together.
When dealing with Maximum Material Condition (MMC) in hole positions, you’re working within a framework where tolerances are feature-dependent. This complicates standard Cp and Cpk calculations, but it can be managed with the right approach.
Understanding MMC and Its Impact
Steps to Calculate Cp and Cpk with MMC
VC = MMC size ± positional tolerance at MMC
Capture both hole size and true position deviation from nominal
For each hole, calculate the allowed positional tolerance = MMC tolerance + (actual hole size – MMC size)
This gives you a normalized positional error based on the dynamic tolerance
Alternative: Use True Position with Bonus Tolerance
Some companies instead use true position results with bonus tolerance calculated, and then calculate Cpk against a fixed boundary like the virtual condition.
Recommendation
When MMC is involved, it’s best to perform Cp/Cpk analysis on the resulting positional error vs. allowable positional tolerance, not raw feature data.
Hi All,
I have two questions on a practice test I’m having trouble answering.
Thanks!
Hi Jennifer,
I moved the question to the member-only thread here and should be able to work it shortly.
Please post any questions there and away from the public pages.
Thanks, Ted.
Ok, no problem. Thanks!
Hi
What is different between natural tolerance and standard deviation?
are both formula are same?
– Cpk Upper = USL – Mean / 1/2 of natural tolerance
– Cpk upper = USL – Mean / 3* standard deviation
While natural tolerance and standard deviation are closely related, they are not the same and their formulas are not interchangeable.
1. Standard Deviation (σ):
This is a statistical measure of variability or spread in a data set. It reflects how much individual measurements deviate from the mean.
2. Natural Tolerance:
This refers to the range that includes nearly all the data in a normal distribution. That’s typically ±3σ from the mean. So the full natural tolerance is:
Understanding the Formulas:
Let’s clarify the two Cpk formulas you mentioned:
Cpk Upper = (USL – Mean) / (½ Natural Tolerance)
This assumes the natural tolerance is 6σ, so ½ would be 3σ, which brings us to…
Cpk Upper = (USL – Mean) / (3 × σ)
Cpk Lower = (Mean – LSL) / (3 × σ)
Cpk = min(Cpk Upper, Cpk Lower)
So yes, the correct and standard formula uses 3 × standard deviation in the denominator, and this corresponds to using half of the 6σ (natural tolerance) range.
Summary:
And if you’re ready to build even stronger capability analysis skills:
Wide range of specification limit is impacted on ppk value ? If it is what is reason ?
Yes, a wide range of specification limits does impact the Ppk value, and here’s why:
Understanding the Ppk Formula
Where:
Impact of a Wider Specification Range
Why This Matters
A higher Ppk indicates that the process output is well within the specification limits, so wider specs make the process appear more capable. However, this can be misleading if the spec limits are too loose relative to customer or functional needs.
Summary
Further Reading
Hi,
I prepare the BB IASSC certification. You can send me the article even better for me, as you propose.
Thanks a lot.
Hi Katia,
This is already available inside the member’s area. I’ll catch up with you over email.
Best, Ted.
Hi,
We are a resin compounder. We buy prime or recycled resin as a raw material and add modifiers/colorants to produce custom resins for injection molders. We have a new customer that that molds automotive parts from our resin. They want us to provide Cpk data on our compounding process. Our process is one of discrete batches. For example, we have a blender that holds 5000# of a resin recipe. We compound a small amount of the batch and perform property testing on it. If it tests in spec, we run out the batch. If it needs a recipe adjustment for a certain tested property, then we make the adjustment and repeat the process. What we end up with over time is a collection of lot data that is always in-spec but scattered all over the place because when a batch is in-spec we run it out (whether centered or just barely in). Also, our lots for this resin run only four or five times a year. Can we make a case that our bulk material process of discrete batches is just not suited to the type of Cpk statistical analysis they want? Thanks, ME
Hey, Mark,
This is a very insightful and well-posed question, and you’re absolutely correct to question whether traditional Cpk analysis is a good fit for your discrete batch compounding process.
What Cpk Assumes
Cpk is intended for continuous, stable processes—typically high-volume, repeatable manufacturing. It assumes:
Your compounding process is:
Making the Case
Yes, you can make a strong case that traditional Cpk analysis does not apply. Instead, consider proposing:
1. Capability Reporting by Batch
Report the mean and range of each property for each lot, along with the specification window.
2. Performance Summary Over Time
Provide a summary of all batches over a 12- or 24-month period, highlighting that 100% have conformed to specification limits.
3. Alternative Metrics
4. Control Plan Assurance
Explain your control plan: material verification, in-process checks, and recipe adjustments to guarantee spec conformity.
Next Steps
It’s very reasonable to educate your customer that Cpk isn’t meaningful in your context. But you’re still providing a highly controlled, compliant product! If needed, invite a technical discussion or QA review to align on alternative quality metrics.
This approach shows your commitment to quality and process control, even if the classical Cpk doesn’t apply.
Hi Ted,
I have learned that you should calculate Cp and Cpk when your process is stable and take a production run of 30 parts without making any adjustments to the machine. I am working with a CNC machine and wish to calculate its capability to hold the tolerance. But, with every part produced, the dimension goes down because of the tool wear and I cannot make a run of 30 parts without making adjustments. How can I calculate Cp or Cpk in this scenario?
It doesn’t sound like the process is stable then.
You’re absolutely right that Cp and Cpk assume a stable, in-control process—but tool wear violates that assumption, as it creates a consistent drift over time.
Here’s how you can approach Cp/Cpk in your scenario:
1. Segment the Process (Before and After Adjustment)
If possible, break your data into segments where the process is relatively stable. For example:
You can calculate Cp/Cpk for these stable windows individually.
2. Include Tool Wear as Part of the Natural Process Variation
In some applications, it’s valid to include the entire cycle—from fresh tool to worn tool—in the capability study. This gives you a realistic view of your total process performance across typical operation.
But caution: This will likely lower your Cpk because it includes the full extent of variation.
3. Use Control Charts to Understand Wear Pattern
Implement X̄ & R or I-MR charts to track how the dimension changes over time. This helps in predicting tool life and defining a proactive tool change schedule that stabilizes the process.
4. Dynamic Cpk Strategy
If you’re forced to make periodic adjustments, treat each cycle between adjustments as a mini-process. Measure parts within each cycle and compute local Cpk. Then, average them or analyze trends to assess capability under real production conditions.
Key Point
In this case, Cp and Cpk are not invalid—but they must be interpreted in the context of known instability (i.e., tool wear). The better strategy might be to use SPC with run rules and predictive maintenance instead of relying solely on static Cp/Cpk numbers.
Hi , I need help on understanding the symbol & before a dimension in thedrawing. Is this related to SPC?
Hi George,
I’m not familiar with that symbol in that context. Can you share an example?
Hi,
Please, who can tell me how to find the constant “d2” for samples size exceeds 5 (30 samples for example). Table, an empirical function?
Another point, “d” depends on the number of measurements for the subgroup or number of subgroups. in several references, I find that it represents the number of measures by the subgroup
Thank you
Bessem,
We have a few resources on data sampling techniques and sample size here.
Best, Ted.
may i know wht is the relation between sixsigma tabulated values in ppm to cp&pp
Hi Sathesh,
Thank you for the question.
See the article here.
Best, Ted.
Hi, I have a specification, which sets 6 limits for a production process.
1-each measurement less than 6.5 then Acceptable
2-each measurement 6.6 to 7.5 then Borderline
3-each measurement greater than 7.6 then Rejectable
4-average of 4 measurement less than 5 then Acceptable
5-average of 4 measurement 5.1 to 6.5 then Borderline
6-average of 4 measurement greater than 6.6 then Rejectable
I am asked to make control chart for individual measurements and range. I have no problem for creating individual measurements control chart, but cannot figure out how to find my upper and lower limits for range chart based on the above conditions.
Hi, and thank you for your detailed question!
You’re working with a dual-criteria specification system—one for individual measurements and another for the average of 4 measurements. It’s great that you’ve got the individuals control chart under control; now let’s address your question about creating a control chart for the range (R-chart).
Clarifying Specification Limits vs. Control Limits
It’s important to distinguish two key concepts:
How to Construct the R-Chart
To create control limits for the R-chart, you do not directly use the specification limits. Instead, you calculate the control limits based on your observed sample ranges. Here’s how:
Step 1: Collect Your Data
For each subgroup of 4 measurements, calculate the range (max – min).
Step 2: Calculate the Average Range (𝑅̄)
Step 3: Apply R-chart Control Limit Constants
For subgroup size n = 4, use these constants:
Then calculate:
Why Not Use Spec Limits for Control Charts?
Your specification conditions are for acceptance criteria, not for detecting changes in process stability. Control charts help detect special cause variation—process shifts and trends—regardless of whether the output is within spec.
How to Align Both Approaches
You can overlay spec zones on the individual chart for visual inspection, but the control limits for the range chart must remain based on statistical calculations, not specification thresholds.
Resources to Help Further
I’m studying for the Lean Six Sigma Yellow Belt
Great, Franz – how can I best help?
Hi Ted. I have a manager asking me to provide CPk data for a special design characteristic feature. We typically do not use CPk to track these, because our processes require that we measure every part and document our results. Special design characteristics have a very small tolerance band, thus the CPk value will be naturally low. The parts are pass/fail depending upon the measurement results, and some scrap is expected. Am I thinking about this correctly? And if so, can you give any advice on how I can simply explain to this manager why his request is unreasonable? Thanks
You’re absolutely thinking about this correctly, and you’re not alone. This is a common situation when special design characteristics with tight tolerances are involved.
Why Cpk Isn’t Always Meaningful Here
How to Explain This to Your Manager
You could say something like:
Alternative Suggestions
if we have
Cp=1
Cpk=0.78
then what is process actual capability.
??????
Excellent question! To understand the process’s actual capability, we need to interpret what Cp = 1 and Cpk = 0.78 imply:
What Cp = 1 Means
Cp measures the potential capability of the process assuming it is perfectly centered between the specification limits. A Cp of 1 means that the process spread (6σ) exactly matches the specification width. This indicates that in theory, the process is capable of meeting specifications—but only if it is perfectly centered.
What Cpk = 0.78 Means
Cpk accounts for how centered the process is. A Cpk of 0.78 indicates that the process is not centered within the specification limits, and the actual performance is worse than its potential. It means the process mean is closer to one of the specification limits, increasing the likelihood of defects.
Actual Process Capability
In practical terms, the actual capability of the process is described by Cpk, not Cp. Therefore, the actual process capability is 0.78.
This suggests that:
Additionally, if you’re interested in preparing for your certification, consider our comprehensive courses:
Hi Ted. Let’s say i have 30 parts to run for getting the CPK data. In the middle of the process, one of my parts was failed the result, 1/30 part. So i need to adjust the machine as to ensure the part result pass (assuming there have machine issue). Do i need to remeasure all those 29 parts after adjusting the machine?
Azim,
If you change the process (ie adjust the machine), you have a completely new process.
Take a look at this quincunx demonstration and you’ll understand why.
Best, Ted.
Can Cp/Cpk be like around 10-20 range?
Well, let’s look at the math.
Cpl = (Process Mean – LSL)/(3*Standard Deviation)
Cpu = (USL – Process Mean)/(3*Standard Deviation)
Cpk is merely the smallest value of the Cpl or Cpu denoted: Cpk= Min (Cpl, Cpu)
Can you construct a scenario where you would get a Cpk in that range?
@Ted Hessing, Could you pls share more insights into the statement where it say if Cpk= Ppk, the process is under statistical control.
Gaurave,
Did you see the paragraph before that statement?
What can I clarify here?
Best, Ted.
I want to assess the impact on Cp when I chop a tail of a distribution which is normal to begin with. If you have a ready reference please let me know.
I am thinking of the following: say we have normal distribution data with a given sigma and mean.
Now I want to see if I remove the lower 10th percentile and the top 90th percentile of the data what will happen to my cp and cpk.
I am thinking of the following approach
1. Knowing 10 and 90th percentile work through the z value and come up with the corresponding x values for these percentiles
2. Make these new x values as the new say 6 sigma values and compute the new sigma – this is trivial but it is a step
3. Compute the new cp and cpk using the same mean but new sigma.
The question is: is there a mathematical formulation that you can point to vs doing this manual operation. Is this approach valid or there are other approaches?
Excellent question. You’re exploring a nuanced topic that intersects statistical theory with real-world capability analysis. Here’s a breakdown of your approach and some deeper context.
Your Approach (Truncating the Distribution)
This is conceptually valid as an approximation, and it’s a reasonable exploratory method. But it’s important to understand that:
Mathematical Formulation
The variance of a truncated normal distribution is not simply based on the new range. It is derived from:
Where:
So to do it rigorously, you should recalculate the mean and variance of the truncated distribution using this formulation, and then use that to compute Cp and Cpk.
Alternative Approaches
Your manual approach is valid as an exploratory method, but to make it analytically accurate, you should use the truncated normal distribution’s actual variance and mean adjustments.
which parameter can be consider for calculating Cp and CpK value for parenteral from below,
pH
Colour index
Assay
weight per ml
particales
When selecting parameters for calculating Cp and Cpk for a parenteral (injectable) product, you want to focus on continuous, measurable characteristics that directly reflect process consistency and product quality.
Evaluation of Parameters:
Continuous, measurable, and typically has tight specs. Excellent candidate for Cp/Cpk analysis.
Usually subjective or categorical unless measured using a spectrophotometer with numerical output.
Critical quality attribute. Quantitative and usually required to be within a specific percentage range.
Measurable and consistent across batches. Useful for process capability analysis.
Typically counted and compared to limits. Treated as an attribute (pass/fail) or Poisson-distributed; not suitable for Cp/Cpk.
Best Parameters to Use for Cp/Cpk:
Learn More:
You’re on the right track—focus on the parameters that are quantitative, stable, and have defined specification limits.
How many number of batches Require for caculation of Cp & CPk Valules in Anual product quality review
Well, in what cases do you need multiple batches? What kind of data are you processing?
When preparing an Annual Product Quality Review (APQR)Recommended Minimum Number of Batches- Minimum: 25–30 batches. This aligns with standard Six Sigma practice for reliable statistical analysis
- Ideal: All batches produced in the review period. (Thinking usually over 12 months, as APQR aims to assess overall process performance for the year.)
- Captures process variability across time, shifts, operators, and raw material lots
- Improves confidence in Cp/Cpk values as indicators of long-term capability
- Meets expectations of regulatory bodies like FDA and EMA for a robust product review
- Ensure that data used is from a stable and in-control process (no major deviations or OOS events)
- Group similar product variants separately if their specifications or process conditions differ
Why Include More Batches?
Important Considerations
I’d aim for
all eligible batches from the year in your APQR; at the very least, use 30 batches to ensure meaningful Cp/Cpk analysis.1. Cpk is a process capability index that measures how close a process is running to its specification limits [(Upper specification Limit(USL) and Lower Specification Limit (LSL)], relative to the natural variability of the process. It evaluates how well the data fits into the specification limits. A comparison is made by forming the ratio of the spread between the sample mean and process/ product specifications, as measured by 3 standard deviation (std.Dev.) units (the process”width”).
Cpk= Process Capability Index
USL= Upper Specification Limit
LSL= Lower Specification Limit
µ= Mean (Average)
σ=Standard Deviation
Cpk= Min. [(USL- µ)/3 σ, (µ-LSL)/3 σ]
Or
Cpu= (USL- µ)/3 σ
Cpl= µ-LSL)/3 σ
Cpk= Minimum of {Cpu & Cpl}
2. A Cpk≥1.33 is desirable, a value of Cpk=0 implies that 50% of the process output falls beyond the specification limits. The larger the index, the less likely it is that any parameter will be outside the specification.
3. If Cpk is between 1 and 1.33, site may review to improve the product process. Evaluate if any repeated OOS/OOT results are being logged. Evaluate all changes pertaining to manufacturing and analytical processes. Detailed assessment shall be performed to identify the actions to improve the Cpk.
4. If Cpk is less than 1, action shall be taken to review and correct the product process.
i need guideline of above information
Here’s a clear and concise guideline format based on your content that you can use for internal SOPs, training materials, or audits:
Cpk (Process Capability Index) – Guideline
1. Definition
Cpk measures how well a process fits within its specification limits by evaluating how centered the process mean (µ) is between the Upper (USL) and Lower (LSL) Specification Limits, relative to the process variability (σ).
2. Formula
3. Interpretation
4. When to Use Cpk
5. Key Notes
This structure can serve as your go-to guideline for interpreting and managing Cpk values effectively.
Hi, can be Cp=4.395
Cpk=1.688
Usl =42,4
Lsl =42
6s=0.091
Thank you for your question! Let’s analyze the values you’ve provided:
First, verify Cp:
Cp is calculated as
(USL - LSL) / 6σ. Plugging in your numbers:(42.4 - 42) / 0.091 = 0.4 / 0.091 ≈ 4.395, which matches your Cp. So this value is correct.Next, evaluate Cpk:
Cpk is the minimum of
(USL - μ) / 3σand(μ - LSL) / 3σ. Since the process is centered between a very tight spec range (only 0.4 units wide), a Cpk of 1.688 suggests the process mean is not exactly in the center but is slightly closer to one limit than the other. While the Cp shows the process potential capability, Cpk shows the actual performance considering centering. Both can be accurate together if the process is off-center.These values are internally consistent and possible given a tightly controlled process with a very narrow tolerance band. Such high Cp values are rare and often found in extremely high-precision processes like semiconductor manufacturing.
If question is asking us to evaluate the process capability. Do we need to calculate Pp & Ppk as well in addition to Cp & Cpk?
Hi Dora,
Whether you calculate Pp and Ppk in addition to Cp and Cpk depends on the specific context of the question and whether the process is stable.
Key Differences
When to Use Each
Answering the Question
If the exam or audit question is vague (e.g., “evaluate process capability”), and no process control status is mentioned:
Further Reading:
Summary: Use Cp/Cpk if the process is stable; use Pp/Ppk if not. When in doubt, report both with a brief explanation.
Hi ted
what to do if CPK calculation get fail ? if it found below 1.33
Larger is better. The larger Cpk is, the less likely any item will be outside the specification limits.
Sounds like you should take action to look for common cause variation, address that, and then re-check the capability to see if you’ve increased the stability of your process.
Hi, It is really good for understanding, do you have any excel template, of Cp, Cpk which can automatically create Histogram, Conntrol chart, after putting values
I do not, Karunesh. But that is a good suggestion.
If I have a been provided only the minimum and maximum values of the data set, can CpK be calculated?
Thanks for your question! If you’ve only been provided with the minimum and maximum values of a dataset, unfortunately, you can’t accurately calculate Cpk. The Cpk (Process Capability Index) relies on both the process mean and the process standard deviation (σ), which require more detailed data than just the range.
While the range (max – min) gives a rough sense of data spread, it doesn’t reflect how data is distributed within that range, especially if there are outliers. To calculate Cpk properly, you need subgroup data or at least a reliable estimate of the process mean and standard deviation. That way, you can apply the formulas:
Cpk = min[(USL – μ) / (3σ), (μ – LSL) / (3σ)]
If you’re working from limited data and still want to assess capability, you might consider other approaches like estimating σ from a range using X-bar and R charts if subgroup data is availabl, but this still requires more than just two values.
Let me know if you’d like help finding alternative ways to estimate capability based on the data you have!