

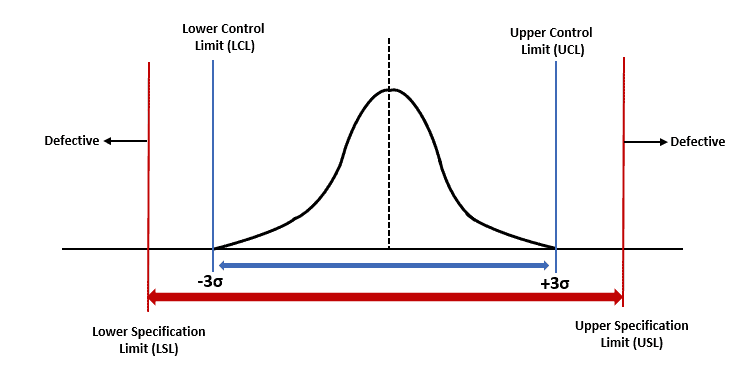
Specification limits are the targets set for a product or the process by customer or market performance; often, the Voice of the Customer is the input for these criteria. In other words, it is the intended result of the metric that we measure.
Customers set the limit (upper and lower) on the product characteristics that define where the product works and where it does not. If the product falls outside of these limits, assume that the customer will reject the product. Specification limits are related to product design. Hence, set these limits in the design phase of the product life cycle.
The Two Types
Upper Specification Limit: The highest limit a customer would accept.
Example: A customer would wait in line at a drive-through for 7 minutes before being dissatisfied.
Lower Specification Limit: The lowest limit a customer would accept.
Example: A customer would expect no less than 100 M&Ms to be in a packet before being dissatisfied.
Why Specification Limits?
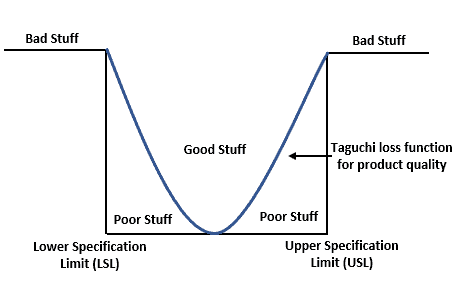
The customer defines limits where the losses due to variation are equal to the product’s benefit. Generally, these values are drawn on the histogram. If the product falls between the USL and LSL, then the product meets the customer’s requirement. In other words, they determine the process capability and the sigma value.
What are Natural Process Limits
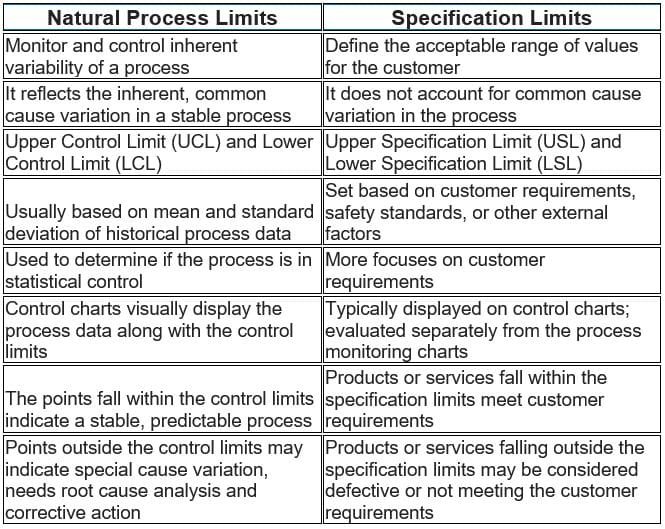
Process control limits, also known as Natural process limits help to monitor and manage the inherent variability of a process. The process control limits are typically derived from statistical analysis of historical process data and are used to identify whether a process is in a state of statistical control.
Process control limits are derived from statistical analysis of historical process data. Typically defined as the mean (average) ± a certain number of standard deviations. Process variations within these limits are considered normal and expected.
Process capability indices
Cp and Cpk are called Process Capability. Pp and Ppk are called Process Performance. In both cases, we want to try to verify if the process can meet to meet Customer CTQs (requirements).
Cp and Cpk values help to determine the Process Capability. Generally, you use this when a process is under statistical control. Whereas Pp and PPk are for Process Performance. Generally, you use this when a process is too new to determine if it is under statistical control.
- Cp (Process Potential)- Tolerance width divided by process capability = (USL – LSL) / (6*σ)
- Cpl and Cpu are the one-sided capability ratios Cpl = (µ-LSL) / (3*σ); Cpu = (USL-µ)/ (3*σ), µwhere is the target for the process
- Cpk is the process capability index Cpk = min (Cpl, Cpu)
- Pp (Process performance) = (USL – LSL) / 6* s, In Pp, s is the standard deviation
- Ppl=(xbar- LSL)/ 3s ; Ppu= (USL – xbar)/ 3s, where xbar is the Process Mean
- Ppk is the process performance index Ppk= min(Ppl, Ppu)
Difference between Specification limit and Control limit
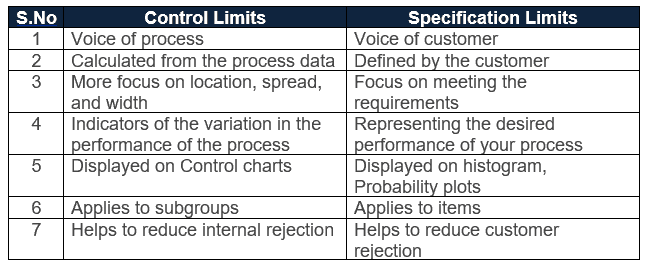
Control limits are the limits of variation that are expected from a process when the process is in statistical control. Furthermore, control limits are calculated from the process data, so it is called the “Voice of process.”
The specification limit is different than the control limit. The customer defines these values; hence it is called the “Voice of Customer.”
Usage of Specification limits and Control limits
- You should not use specification limits to judge whether a process is in statistical control; that decision relies on control limits alone.
- However, comparing specification limits to control limits is exactly how you assess process capability, whether a stable, in-control process is also able to meet the customer’s requirements, as shown in the cases below.
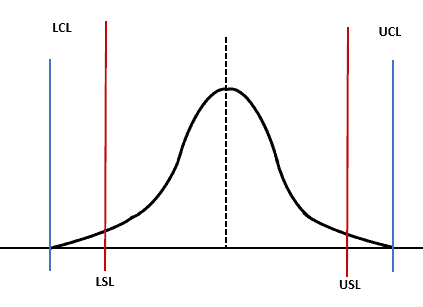
Case 1: Specification Limit falls within Control Limit.
If specification limits fall within the control limits, part of the process may function outside the customer’s set range. So, the process is producing defects.
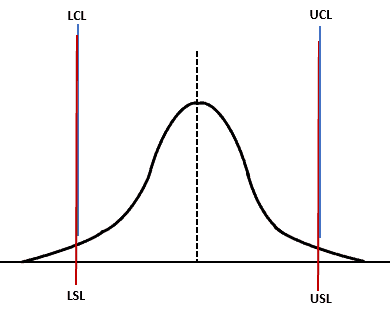
Case 2: Specification Limit Coincides with Control Limit
If specification limits fall on control limits, the process variation is common, and the process may meet the customer’s requirements. However, it may produce a defect because of the possibility of influence with an uncommon source of variation.
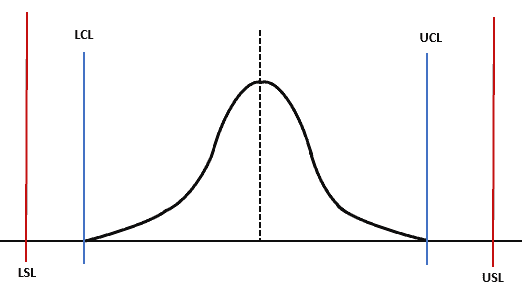
Case 3: The Control Limit falls within the Specification limit
If control limits lie within the specification limits, production is stable within our capability. It produces the best design and no major issues in production. Also, the process meets the customer’s specifications.
Can we use the specification limit and control limit together?
You should not use specification limits and control limits together to judge whether a process is in statistical control, since only control limits answer that question. However, comparing the two together is standard practice for assessing process capability, as shown in the three cases above; control limits reflect the voice of the process, while specification limits reflect the voice of the customer.

Comments (6)
Good presentation of the materials. Thank you!
Thanks for the kind words, Dave!
Hello, thanks for the great content. I actually have a question. Are the specification limits always expressed in the project goal of the project charter? For instance, if the goal is reducing the waste of 1%, is it correct to consider this 1% less as a tolerance limit?
Hi Lou,
The specification limits and the project goal stated in the project charter may not always be expressed in the same way.
The specification limits typically define the acceptable range or tolerance for a specific parameter of a product or process. In other words, boundaries within which the product or process should operate.
On the other hand, the project goal stated in the project charter represents the desired objective that the project aims to achieve.
In short, The goal may not always directly correspond to the specification limits.
In your example, if the goal stated in the project charter is to reduce waste by 1%, it does not necessarily mean that this 1% reduction should be considered a tolerance limit.
Thanks
Good article.
Slightly confusing at the end, where you say you can’t graph SL and CL together, then proceed to do so, then follow up by saying that again, you can’t use them together.
Like a control limit exists mainly on control charts for process capability, and after obtaining that comparing to spec limits helps define next steps i would think, so no you don’t just graph them together for continued purposes, but every now and then do literally do so?
Thanks for flagging this, JR; you’re right, and looking back at the page, it does contradict itself. It says you cannot draw both on the same graph, then walks through three cases comparing where specification limits fall relative to control limits, then later says they cannot be used together at all.
Here is the clearer version: control limits (UCL/LCL) come from the process itself, the “voice of the process,” and reflect what the process is naturally producing. Specification limits (USL/LSL) come from the customer, the “voice of the customer,” and reflect what the process is required to produce. You would not use specification limits to judge whether a process is in statistical control; that decision only uses control limits. But comparing the two, exactly like the three cases on the page do, is how you assess process capability: whether a stable, in-control process is also capable of meeting the customer’s requirements.
So the short version: don’t use spec limits to judge control, but comparing them to control limits is exactly how you judge capability, which is the “every now and then” case you picked up on. I’ll get the wording on the page itself cleaned up since it really does say both things.