Process Capability
How do you know if your process is capable? Process Capability Pp measures the process spread vs. the specification spread. In other words, how distributed the outcome of your process is vs. what the requirements are.
If you’d like more depth, including calculations, etc., see these articles:
- Process Capability & Performance (Pp, Ppk, Cp, Cpk) Overview
- Process Capability (Cp, Cpk)
- Z score and process capability
Note: Use Pp & Ppk when you are initially setting up your process. After a process has reached statistical control, use Cp & Cpk.
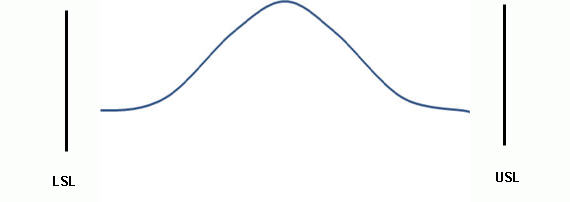
Let’s imagine that your process has 2 specifications; a Lower Specification Limit (LSL) which is the lowest value allowed, and an Upper Specification Limit (USL), the highest value allowed. We call the difference between the two the specification spread, sometimes referred to as the Voice of the Client.
The process spread is the distance between the highest value generated and the lowest. We sometimes refer to this as the Voice of the Process.
Process Spread vs. Specification Spread
Think of the Specification Spread as the sides of your garage – those are static, they are not moving, and it is important that your process puts values inside those bounds. The Process Spread is the size of the car you are trying to fit in.

Can A Process Meet Specifications?
The answer is in the amount of variation in your process. If your process spread exceeds the specification spread, then the answer is no. However, if the process spread is less than the specification spread, then process variation is low enough for it to fit.
Process Meets Specifications: Good Potential Performance
Process Does NOT Meet Specifications: Bad Potential Performance


Calculating Process Capability (Pp)
Pp = (USL – LSL) / 6 * s : where “s: the standard deviation, or the ‘fatness’ or dispersion of the bell curve.
What is a ‘Good’ Process Capability (Pp) Number?
According to Six Sigma, we want a Pp of above 1.5 because that would reflect a process with less than 3.4 DPMO – the definition of 6 Sigma quality.
How do we come to that?
Well, we want to have 6 sigmas (standard deviations) between the mean of the process and the LSL. Since a normal distribution is symmetric, that means we also want 6 sigmas between the mean and the USL. That’s a total of 12 sigmas between the USL and LSL.
In other words, USL – LSL should = 12 for us to reach 6 σ quality standards of 3.4 DPMO.
See how that is reflected in the equation Pp = (USL – LSL) / 6* s?
Let’s replace (USL – LSL) with 12: Pp = (USL – LSL) / 6* s = 12 σ / 6 * s = 2 σ / s
Process Capability Index
Is the Process Acceptable? Ppk (Capability)
Ppk is another performance index that measures how close the current process means proximity is to the specification limits. In other words, does this process deliver acceptable results?
We tell this by trying to see how centered the process is. If the process is not centered well, it is deemed not acceptable.

Calculating Ppk
There are two ways to calculate Ppk, depending on how your process aligns.
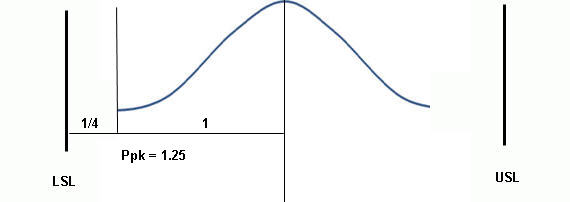
Process Mean close to USL
If your Process Mean (central tendency) is closer to the USL, use Ppk = [ USL – x(bar) ] / 3 s, where x(bar) is the Process Mean.
Process Mean close to LSL
If your Process Mean (central tendency) is closer to the LSL, use Ppk = [x(bar) – LSL ] / 3 s, where x(bar) is the Process Mean.
Interpreting Ppk Scores
A Ppk of 1 means that there is “half of a bell curve” between the center of the process and the nearest specification limit. That means your process is completely centered.
Pp, Ppk In Relation to Z Scores
Ppk can be determined by dividing the Z score by three. A z score is the same as a standard score; the number of standard deviations above the mean.
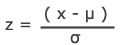
Z = x – mean of the population / standard deviation.
Ppk = ( USL – µ) / 3σ = z / 3
ASQ Six Sigma Green Belt Process Performance Questions
Question: Which of the following measures is increased when process performance is improved?
(A) Variability range
(B) Capability index
(C) Repeatability index
(D) Specification limits
Answer:
B: Capability Index. The capability index increases as the process improves.
You would immediately discount the Variability range as we judge a good process with low variability. We can also discount specification limits as those hold steady regardless of the performance of the process (because they are defined by the voice of the customer.)
Repeatability is the variation between measurements that occurs when one person measures the same item several times under identical conditions and using the same measuring equipment. The standard Six Sigma BOKs do not list a repeatability index, but there is a repeatability coefficient in biology that increases as sigma (the standard deviation) increases. In that case, a process with better performance would have smaller standard deviations, decreasing the index.

Comments (40)
Very helpful ..
Glad to be of service, Amrita!
Very helpful……..thank you so much.
Glad it helped!
Very helpful, Nice
If a process has a variance of 4 units and a specification
of 96 ± 4, what is the process performance index (Pp)?
(A) 0.33
(B) 0.66
(C) 1.00
(D) 1.50
Idris- can you tell me the steps you took to try to solve this?
USL = 96+4 = 100
lSL = 96-4 = 92
VARIANCE = 4
Pp = (USL – LSL)/(6 x sq. root of VARIANCE)
= (100 – 92)/(6 x 2)
= 0.666
thankyou so much for providing solutions.
I’ve added this question and a full answer walkthrough to the thousands of others available in the paid membership areas.
0.66
USL = 100
LSL = 92
Variance is 4
Standard deviation = Square root (4) = 2
Pp = (USL-LSL)/ (6*Standard deviation)
Pp= (100-92) / ( 6*2)
Pp= 8/ 12
Pp = 0.6667
Pp is 0.66
0.66
Hi Ted Hessing.
If we calculate like this, the Ppk and Cpk is equal?
Because the recipe to calculate them are the same.
Hi Pham, Can you show me an example below?
It is the same calculation:
Calculating CPK (from https://sixsigmastudyguide.com/process-capability-cp-cpk/):
Cpl = (Process Mean – LSL)/(3*Standard Deviation)
Cpu = (USL – Process Mean)/(3*Standard Deviation)
Calculating PPK (from https://sixsigmastudyguide.com/process-performance-pp-ppk/):
Process Mean close to USL
If your Process Mean (central tendency) is closer to the USL, use: Ppk = [ USL – x(bar) ] / 3 s, where x(bar) is the Process Mean.
Process Mean close to LSL
If your Process Mean (central tendency) is closer to the LSL, use: Ppk = [x(bar) – LSL ] / 3 s, where x(bar) is the Process Mean.
What would the Ppk be for a process with average of 50, standard deviation of 5, and specification limits of 36 and 72 ?
To calculate Ppk, we use the formula:
Ppk = min[(USL - μ) / (3σ), (μ - LSL) / (3σ)]Given:
Calculations:
Ppk = min(1.467, 0.933) = 0.933
So, the Ppk for this process is approximately 0.933. This value suggests that the process is not fully capable of consistently meeting specifications, especially near the lower specification limit.
0.93
PpK is 23.3333
Great guide, thanks for your help!
You’re welcome, Xuade!
What is the best value and acceptable range of Cp ,Cpk & Pp,PPK
Here’s a refined summary of the best target values and acceptable ranges for Cp, Cpk, Pp, and Ppk based on industry standards and Six Sigma practices:
Cp (Process Capability – Potential):
Use: Short-term potential (spread only)
Acceptable Range: ≥ 1.33 (some industries use ≥ 1.50 for new processes)
Desired Target: ≥ 2.00 (Six Sigma level)
Cpk (Process Capability – Actual):
Use: Short-term capability (spread + centering)
Acceptable Range: ≥ 1.33 for mature processes; ≥ 1.67 for new/critical ones
Desired Target: ≥ 2.00 (Six Sigma)
Pp (Process Performance – Potential):
Use: Long-term performance (spread only)
Acceptable Range: ≥ 1.33
Desired Target: ≥ 1.50–2.00
Ppk (Process Performance – Actual):
Use: Long-term performance (spread + centering)
Acceptable Range: ≥ 1.33 for stable processes; ≥ 1.67 for critical/high-reliability ones
Desired Target: ≥ 2.00 (Six Sigma)
In summary:
1.00–1.33: Barely capable; may require more inspection or control.
≥ 1.33: Generally acceptable for established processes.
≥ 1.67: Preferred for new, critical, or safety-sensitive applications.
≥ 2.00: Represents world-class, Six Sigma-level performance.
Remember, Cp and Cpk use short-term variation and assume the process is in control, while Pp and Ppk reflect long-term performance and include all variation. That’s why Cp/Cpk typically appear more favorable than Pp/Ppk.
what if the CPK value is at 5.63 and Ppk at 2.58 but the xbar chart is having some points out of control limits.
How I should evaluate?
This is a fascinating and important scenario that highlights the distinction between process capability/performance indices and process stability.
Understanding the Metrics
How to Evaluate
The key issue here is process stability. Even though Cpk and Ppk are high, if your X̄ chart shows points outside control limits or non-random patterns, your process is statistically not in control.
Here’s how to evaluate and address the situation:
Conclusion
High capability numbers are only meaningful when the process is stable. Prioritize investigating and correcting the sources of instability shown in your X̄ chart. Once the process is stable, your Cpk and Ppk values will more accurately reflect true performance.
Additionally, if you’re interested in preparing for your certification, consider our comprehensive courses:
Being a more difference between Cpk and Ppk looks like special cause exists in the process. Remove those special cause/s and again check whether any point going out of UCL/LCL.
If then there is marginal difference between Cpk and Ppk and any point still showing out of control limit then it it should be acceptable since absolute values of Cpk and Ppk are much higher than six sigma level.
The post has the right idea, but needs a bit of clarification.
What’s Right
What Needs Fixing
So, first get your process stable by removing special causes. Then check Cpk and Ppk. Only when the process is in control do those values really tell you how capable your process is.
For more details, check out: Process Capability & Performance and X Bar R Control Charts.
Great example about a car and garage, it is much simpler to understand!
I’m glad it helps, Kate!
Hello, I like your articles. But it seems like you had a typo hidden:
This is what happens when your specification spread does not match your specification spread!
I think you wanted to say:
This is what happens when your process spread does not match your specification spread!
BR,
Ivan
Thank you, Ivan for the feedback, we have updated the sentence.
Thanks
When do we get Ppk form OSAT?
What is the minimum Sample Size to compute the Ppk?
Pablito, tell me more of what you are thinking here. I don’t want to give people direct answers to their homework problems. I do want to help people think through these concepts.
Cp is generally referred to as Process Capability. Pp as Process Performance. In this article, Pp is however called Process Capability. Is that a typo?
Great observation, and thank you for pointing that out!
You’re absolutely right: Cp is commonly known as Process Capability, which measures how well a process can potentially perform if it were centered and in statistical control. Pp, on the other hand, stands for Process Performance, and it reflects the actual performance of the process over a period of time, regardless of whether the process is in control.
If the article refers to Pp as Process Capability, that may indeed be a typo or a misstatement. The two indices are related but distinct in their application and interpretation. We always strive for clarity in our educational content, so I appreciate your attention to detail.
If you have any more questions or spot anything else, feel free to reach out!
Is there a guide available that shows how to calculate cpk for runout on a sample?
Hi Gloria Peralta,
Runouts are specified with a single value: a not-to-exceed value. For example, the specification for runout could be 0.0005 inches. This means that the Upper Spec Limit (or USL) = 0.0005 in and the Lower Spec Limit is obviously zero.
Assuming that we have a normal distribution, then Cpk for runout:
Cpk = Cpu = (USL – Mean)/(3 * Sigma),
where, Sigma is the rational subgroup estimate of sigma (often referred to as the short-term standard deviation).
Thanks
How did fix limitations of Cpk => 1.33..?
Is there any calculations / rules for this..?
I’m not sure I understand what you’re asking here. Can you elaborate?