The EWMA – Exponentially Weighted Moving Average chart is used in statistical process control to monitor variables (or attributes that act like variables) that use the entire history of a given output. This differs from other control charts that treat each data point individually.
The user gives each output (previous sample mean) a weighting. The most recent samples are weighted the highest. This means you give the oldest data the least amount of weight. The chart displays the data geometrically. This gives the advantage of the chart not being greatly affected when a small or large value enters the calculation.
The EWMA chart will detect shifts of .5 sigma to 2 sigmas much faster than Shewhart charts with the same sample size. They are, however, slower in detecting large shifts in the process mean.
Another advantage is that each data point plotted on the chart represents a moving average of points. Thus you can use the Central Limit Theorem to say that the plotted points (the moving average of the subgroups) are normally distributed, and the control limits are clearly defined.
Use EWMA Charts When:
- When you have continuous data from the entire life of a process.
- You want to detect small shifts in the process. For larger shifts, use Shewart style charts like the X Bar R and the X Bar S charts.
- When you want to measure the mean, monitoring the process variability requires the use of some other technique.
- The subgroup sample size should be > 1. If the sample size in the subgroup is 1, try using an Individual X chart.
- When you want to smooth out the effect of uncontrollable noise in the data.
How to Make an EWMA Control Chart
- Decide the weightings
- Use smaller weightings to discern smaller shifts.
- Set between 0 and 1.
- If you pick a weighting of 1, you have an xbar chart.
- Based on user experience and preference.

- where 0 < l ≤ 1
- We also need to define a starting value of Z0 before the first sample is taken. – If a target value µ is specified, then Z0 = µ. Otherwise, it is typical to use the average of some preliminary data. That is, Z0 = Xbar
- Create the control limits
- Generally, default to 3 standard deviations for Six Sigma quality purposes and to match what other charts generally do.
- May need to change the control limits to something smaller if the weightings are very small.
- UCL =µ+Lσ√λ/(2-λ)
- LCL =µ-Lσ√λ/(2-λ)
- Where L is the length: The control limits are often set at 3, 3 standard deviations from the mean. or use page 5 Lucas and Saccucci
- Plot the points
- Can be either subgroups or individual observations.
- When plotting a subgroup, use the mean of that subgroup.
- Can be either subgroups or individual observations.
- See if the points are within the control limits.
- Look for trends or patterns.
Examples of Uses of EWMA Control Charts
- Detecting drift that is caused by tool wear
- Ex. Manufacturer produces a widget of a certain diameter. If the diameters of the widget are off, there are consequences. Measuring using an EWMA Chart helps understand the manufacturing machine wear and its impact on the creation of the widgets.
- Accounting processes
- Ex. Day-to-day fluctuations in accounting processes may be large but may not necessarily mean the process is unstable. The choice of lambda can be determined to make the chart more or less sensitive to these daily fluctuations.
- Chemical processes
- Website visitors fluctuate depending on the day of the week.
- Ex. This website gets far more visitors when people are at work Monday through Thursday compared to Friday, the weekends, or holidays.
Important Notes on EWMA Charts
- Your data must be time-ordered.
- Consecutive points have the highest chance of being alike – so default to a range of 2 when possible.
- Created for normal data but is robust enough for non-normal data sets.
Example of Using an EWMA – Exponentially Weighted Moving Average – chart in DMAIC
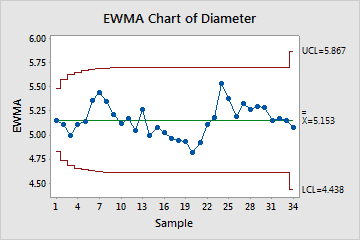
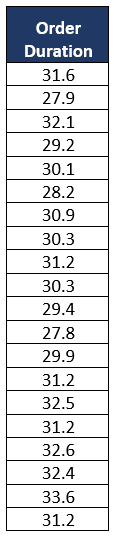
Generate an Exponentially Weighted Moving Average (EWMA) chart based on the cycle time data, depicting the processing duration for customer orders in a car showroom over a specified period. The chart should have a target mean value of 30, a standard deviation of 2.13, and a smoothing factor (λ) set to 0.3.
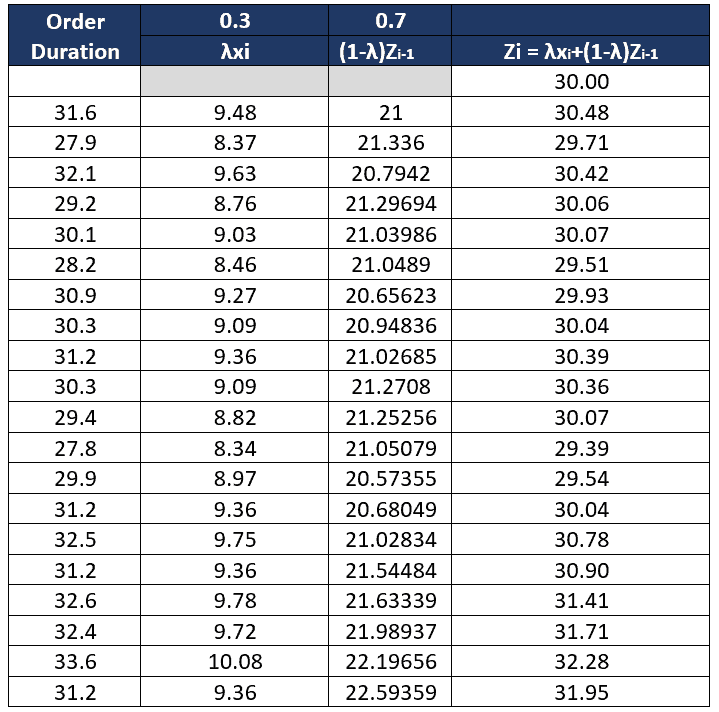
Calculate EWMA (Zi) values
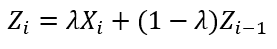
- First value Z0 = µ , Z0 = 30
- Second value (31.6) Z1 = (0.3*31.6)+(1-0.3)*30= 30.48
- Third value (27.9) Z2 = (0.3*27.9)+(1-0.3)*30.48= 29.71
- Similarly, calculate EWMA values for the rest of the duration
Calculate UCL and LCL
- Where µ=30
- L =3
- σ =2.13
- λ=0.3
- UCL =µ+Lσ√λ/(2-λ) = 30+3*2.13*Sqrt(0.3/1.7) = 32.684
- LCL =µ-Lσ√λ/(2-λ) = 30-3*2.13*Sqrt(0.3/1.7) = 27.316
Compute the EWMA chart using Excel or any statistical software such as Minitab
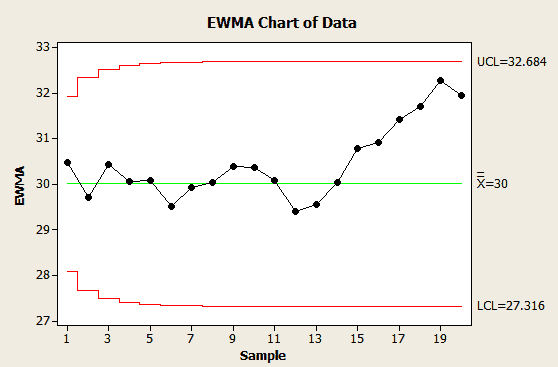
Conclusion: No parameter in the EWMA chart falls outside the control limits. Therefore, based on the established control limits, the process is considered stable during the observed time period. This means that the variation in cycle time is within the expected range, given the selected smoothing parameter (λ=0.3) and control limits.
In the Control phase, it’s essential to continue monitoring the process over time and take corrective actions if any new patterns or points outside the control limits emerge. If the process remains stable and meets performance expectations, it can be considered successfully controlled. If further improvements are necessary, further analysis and improvement efforts may be required.
EWMA Excel sheet
What You Need to Know for Your Exam
Green Belts
The IASSC Green Belt BOK requires you to know EWMAs as part of Statistical Process Control.
Black Belts
The Villanova Black Belt BOK requires you to know EWMAs as part of Advanced Statistical Process Control; “Understand appropriate uses of short-run SPC, EWMA, CuSum, and moving average.“
The IASSC Black Belt BOK requires you to know EWMAs as part of Statistical Process Control.
EWMA – Exponentially Weighted Moving Average – Videos
ASQ Six Sigma Black Belt Moving Average Questions
Question: Which of the following charts plots the mean of a set of values and recalculates the mean with each new value?
(A) Moving range
(B) Moving average
(C) X Bar and s
(D) c
Answer:
When you’re ready, there are a few ways I can help:
First, join 30,000+ other Six Sigma professionals by subscribing to my email newsletter. A short read every Monday to start your work week off correctly. Always free.
—
If you’re looking to pass your Six Sigma Green Belt or Black Belt exams, I’d recommend starting with my affordable study guide:
1)→ 🟢Pass Your Six Sigma Green Belt
2)→ ⚫Pass Your Six Sigma Black Belt
You’ve spent so much effort learning Lean Six Sigma. Why leave passing your certification exam up to chance? This comprehensive study guide offers 1,000+ exam-like questions for Green Belts (2,000+ for Black Belts) with full answer walkthroughs, access to instructors, detailed study material, and more.

Comments (4)
I can’t seem to identify the difference between when to use EWMA and when to use CuSum? They are both for variation, what differentiates them from each other? Thank you!
That’s a good observation, Jo! Turns out that this is a topic for debate.
One of the best treatments is here:
Also see our CUSUM article here.
Hi,
Thanks for the article.
For the example in the article
“Calculate EWMA (Zi) values
EWMA – Exponentially Weighted Moving Average Chart
First value Z0 = µ , Z0 = 30
Second value (27.9) Z1 = (0.3*27.9)+(1-0.3)*30= 30.48
Third value (32.1) Z2 = (0.3*32.1)+(1-0.3)*30.48= 29.71
Similarly, calculate EWMA values for the rest of the duration”
The calculations shown do not give the answers shown,
For example:
Second value (27.9) Z1 = (0.3*27.9)+(1-0.3)*30, this gives 29.37 and not 30.48. To get 30.48, the calculation would need to be (0.3*.31.6)+(1-0.3)*30.
Please can you help with this?
Thank you, Thomas Burgess. We have updated the article.