Z score and Process Capability are used together to get a view of your process. The Z score or value in process capability calculation is the mean distance from specification limits (USL and LSL) measured in standard deviation units.
Z score tells the defects within the system. In other words, Z score tells the number of standard deviation existed between the mean and specification limit.
How Z score impacts process capability in DMAIC project
Six Sigma method can be implemented in any industry with a five-phase structured method – DMAIC. During the measure phase, Six Sigma black belts more focus on Z Score apart from other process performances.
It is very difficult in any organization to define the defects as it varies from process to process. For example, sales, production, and finance departments, defects categories are different in all the three groups. So, it is challenging to compare the process performance. Hence, Z score plays an important role or a common platform to compare all the processes’ performance.
A higher Z score means it has more number of standard deviations within specification limits and the process average is away from the outlying limit. Whereas, lower Z value means it has less number of standard deviation. In other words, there is a variation in the output. If the Z value is higher, most of the values lying near the average and process are capable and also stable.
Benefits of Z score in DMAIC projects
- Z score is a flexible measure to use for both variable and attribute data.
- It helps to create the baseline for the Six Sigma projects. Also, use to assess and compare before and after process performance.
- Z score mandates the six sigma team to define the process mean, standard deviation, specification limits for continuous data. Similarly, defects, sample size etc for attribute data.
- Z score is a universal measurement, that can be applied for different functions within the organization like production, sales, finance, HR, administration etc.
Calculate Z score and process capability one from another
Z scores basically use them to transform a given standard distribution into something that is easy for us to calculate probabilities on. Why? So we can determine the likelihood of some event happening.
Similarly, process capability and performance that’s a measure of how centered a distribution is and how dispersed it is.
Naturally, the greater the spread, the less of a chance a process has of meeting its intended specifications.
Calculating Z value
The area outside of specification for a normal curve can be determined by Z value.
- ZUpper =(USL-X̅)/ σ̂
- ZLower = (X̅-LSL)/ σ̂
- Then, Zmin = The smallest value of ZUpper and ZLower
Where
- σ̂ is the estimate of the process standard deviation
- and σ̂ = R̅/d2
- X̅ is the process mean
If Zmin is negative, theX̅ is outside of the specification limit.
Usually, Zmin is also known as ZST.
Capability Indices
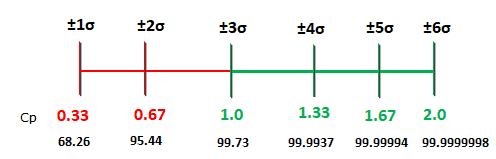
Cp is the distance between the specification limits divided by six times an estimate of the process standard deviation.
Cp =(USL-LSL)/ 6σ̂

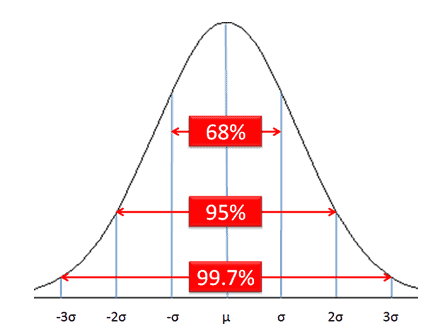
As the entire normal distribution is within the ±3 sigma, Cp really tells how many standard deviations fit inside of the specification limits. But Cp does not take into account whether or not the process is centered. Whereas, Cpk is more useful as it considers the process centered or not.
Cpk is the minimum of upper specification limit minus the current process mean. The current process mean minus lower specification limit (which gives the distance to the closest specification limit) divided by three times an estimate of the process standard deviation.
Cpk =min (USL- X̅, X̅-LSL)/ 3σ̂ = Zmin/3 = ZST/3
Hence, If you have a Z value, the equation is very easy;
Cpk = Dividing the Z score by three.
A z score is the same as a standard score; the number of standard deviations above the mean.Z = (X-µ)/σ
Z = x – mean of the population / standard deviation.
The issue with process capability indices is that the standard deviation estimates based on the local variation. The location variation estimate of the process standard deviation is too small. In other words, it doesn’t reflect the long term. This will be addressed by Process performance indices.
Process performance Indices
The long term process capability indices also known as process performance indices Pp and Ppk.
Pp =(USL-LSL)/ 6s
Ppk =min (USL- X̅, X̅-LSL)/ 3s
Where s is the sample standard deviation of all the data.
Example to calculate the Cpk value using Z score
Example: The process average is 10 with an upper control limit of 18, a lower control limit of 6, and a standard deviation of 2. Calculate the Cpk value using Z score.
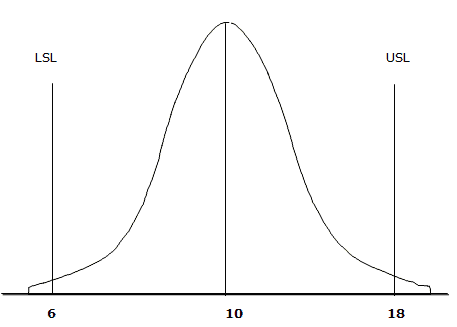
- USL=18
- LSL=6
- σ̂ = 2
Now, compute ZUpper and ZLower
- ZUpper =(USL-X̅)/ σ̂ = (18-10)/2 =4
- ZLower =(X̅-LSL)/ σ̂ = (10-6)/2 = 2
- So, Zmin = The smallest value of ZUpper and ZLower =2
Cpk = Zmin/3 = 2/3 = 0.667
Important Videos
When you’re ready, there are a few ways I can help:
First, join 30,000+ other Six Sigma professionals by subscribing to my email newsletter. A short read every Monday to start your work week off correctly. Always free.
—
If you’re looking to pass your Six Sigma Green Belt or Black Belt exams, I’d recommend starting with my affordable study guide:
1)→ 🟢Pass Your Six Sigma Green Belt
2)→ ⚫Pass Your Six Sigma Black Belt
You’ve spent so much effort learning Lean Six Sigma. Why leave passing your certification exam up to chance? This comprehensive study guide offers 1,000+ exam-like questions for Green Belts (2,000+ for Black Belts) with full answer walkthroughs, access to instructors, detailed study material, and more.

Comments (4)
Nicely compared the process capability in terms of varying Z scores
Thank you! I’m glad you found the comparison helpful.
ZUpper =USL-X̅/ σ̂ = 18-10/2 =4 is not correct
shall be
ZUpper =(USL-X̅)/ σ̂
Hi FU,
We have updated the parentheses in the formula.
Thanks