The Define phase (DMAIC) is the first phase of the Six Sigma improvement process and is critical to its success. As the name indicates, Define is about describing the problem and setting the project goal.
Six Sigma Phases
Six Sigma is a systematic problem-solving approach centered around defect elimination and variation reduction, which leads to process improvement.
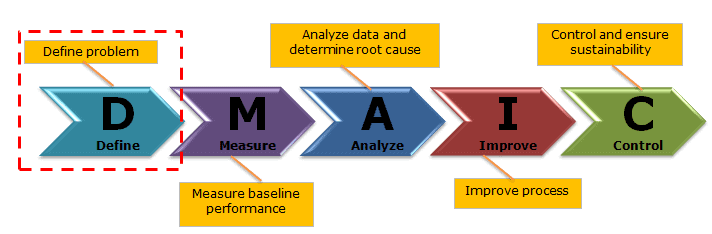
One of the principal tools in Six Sigma is using the DMAIC methodology. (Also see DMAIC Overview). DMAIC is a logical framework that helps you think through and plan improvements to a process to achieve a Six Sigma level of excellence. Five phases of the DMAIC method.
Use the Define Phase of DMAIC to qualify a project to see if it is worth doing, if it is a good fit for the Six Sigma approach, and to set the stage for the project.
Like a good reporter, learn the background of what is being asked and focus on the 5Ws – Who, What, When, Where, and Why. This becomes evident when you use the tools below to identify scope, goals, and rationale.
Goals of Define Phase
- Understand the project, including its purpose and scope.
- Determine whether the process is a good candidate for DMAIC.
- Map the current process.
- Detail customer expectations.
- Estimate timelines and costs using project management tools
DMAIC Define Phase Overview
The Define phase is approximately 2 to 3 weeks based on the project inputs and begins with selecting the project champion.
The define phase is all about establishing the project, and there are many individual activities to complete. Multiple tools and concepts are available in the Define phase of Six Sigma.
Project Basics
What is Quality – The ASQ defines it like this:
A subjective term for which each person or sector has its own definition. In technical usage, quality can have two meanings: 1) the characteristics of a product or service that bear on its ability to satisfy stated or implied needs; 2) a product or service free of deficiencies. According to Joseph Juran, quality means “fitness for use”; according to Philip Crosby, it means “conformance to requirements.”ASQ Quality Glossary
Cost of Poor Quality: Cost of Poor Quality (CoPQ) is defined as the cost associated with providing poor-quality products or services. It is basically a combination of preventive, appraisal, internal, and external failure costs.
CTQ requirements: Critical requirements on process outputs and other critical process performance measures are called CTQ. Critical quality requirements related to customer expectations and needs around the output quality.
Causal Theory y=f(x): Causal theory, in Six Sigma terms, means that you create an output (y) from an input (x) and a function (f)
Process Performance Metrics
We can use many process performance metrics to measure our processes’ current and future value.
Defects per Opportunity (DPO): DPO stands for Defects per opportunity. This is a simple ratio. Take the number of defects you have in your process (usually found by sampling) and divide it by however many opportunities there are.
Defects per Unit (DPU): Defects per unit are a similar calculation to DPO, but instead of looking at opportunities, we’re looking at units.
Defects per Million Opportunities (DPMO): DPMO is based on DPO but in real-world manufacturing type numbers. This is an important metric because it’s used in Six Sigma to measure the performance of a process. If you’ve already worked out DPO for a sample, you can calculate DPMO by simply multiplying the decimal result (not the percentage) by one million.
First-Time Yield (FTY): First-time yield is the most common way to calculate the process yield. It is the number of defect-free units coming out of a process compared to the number of units manufactured. In other words, it is the probability of a defect-free output from a process.
Rolled Throughput Yield (RTY): RTY provides a probability that a process with no defects will generate a unit. In other words, it’s the probability that a multi-step process will produce a defect-free unit.
Lean Metrics
Lean metrics are the measures that can be used to control and monitor the manufacturing processes such that continuous quality can be facilitated by identifying opportunities for improvements and changes.
Cycle time: Cycle time is the average time taken to complete a process per item. It is calculated as the reciprocal of the throughput rate. In other words:
Total Lead Time: Lead time is the total time taken for the work to process from one point to another in manufacturing. It is calculated as the time between two points, known as starting and endpoints.
Process Cycle Efficiency: Process cycle efficiency helps detect how much of the process actually adds value to the entire process.
Project Selection
Select a project with needs and criteria that are appropriate for using DMAIC. The problem could be anything that impacts the Key Performance Indicator (KPI), like process output, customer satisfaction, production cost, defects, rework, cycle time, etc.
Project Cost/Benefit Analysis (CBA): Cost/Benefits analysis examines the project’s projected costs and returns. It gives us data that we need to decide whether a project is worth doing.
Cost of Poor Quality: CoPQ refers to the costs that result from producing defective products or services. It includes both internal failure costs (such as rework and scrap) and external failure costs (such as returns, warranty claims, and loss of reputation). Note that prevention and appraisal costs are not part of CoPQ; instead, they fall under the Cost of Good Quality, as they are incurred to avoid or detect defects before reaching the customer.
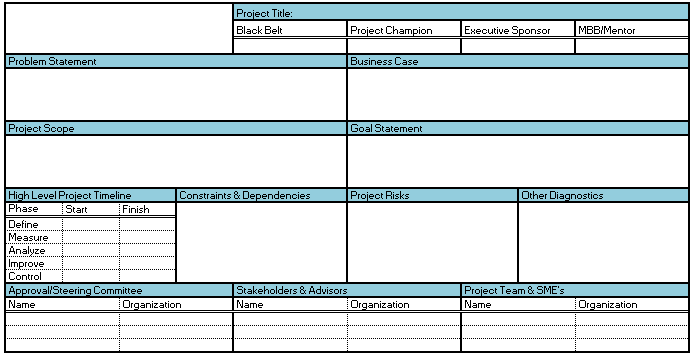
Project Charter: A process charter is a high-level document that provides purpose and motivation for the initiative, serves as a working document for the team, and is a reference for the rest of the company. The project charter is the most important document in the Define phase of Six Sigma, and that will be updated throughout the DMAIC process.
A Project Charter should contain the following elements
- Business case
- Problem statement
- Project scope
- Goal statement
- Milestone/Deliverables
- Resources
Organizations use various tools to make their goals achievable. SMART (Specific, Measurable, Assignable, Realistic, and Time-Bound) is a technique that helps to attain and track project goals.
Current State Process Analysis
SIPOC: A SIPOC is a high-level process mapping tool to help visualize a process and its influences. In other words, it is a useful tool that depicts how a process serves the customer and summarizes the inputs and outputs of a process in a visual format.
Flow chart: A process flowchart is a simple process map that visually represents the sequence of activities and their points of decision. These flowcharts provide the basic details of the process, which can later be augmented by adding different staff roles.
Swim Lane Flow Chart: These process maps provide the interactions between different departments and the roles performed by different people in the organization. Also termed ‘swim-lane’ charts, these process maps have vertical lines showing the movement of the process from person to person.
Input-Output (IPO) Model: The measurement of process inputs and outputs can be used to optimize the measured process. Inputs may be raw materials and resources; outputs are the end products.
Identify Voice of Customer (VOC)
An understating of customer needs is critical for business success. It is necessary for businesses to be constantly in contact with customers. Collecting voice customers is a multi-level task. Below are the tools to get Voice of Client in an effective way:
- Reactive
- Complaint logs
- Hotlines
- Tech support calls
- Website Activity
- Proactive
- Focus Groups
- Interviews
- Surveys
- Comment cards
- Marketing research
- Observation: “Go to the Gemba”
Analyze VOC
Kano Diagrams: The Kano model is a framework to prioritize features based on the degree to which they will satisfy or delight the users. In other words, a model helps to prioritize the features based on how much that feature will delight the users.
CTQ requirements: Critical to Quality requirements related to customer expectations and needs around the output quality.
The Pareto Chart is a graphical tool to map and grade business process problems from the most recurrent to the least frequent. In other words, this helps to identify the most frequently occurring problems or separate the vital few from the trivial many.
Critical-to-Quality Tree: A Critical to Quality Tree (CTQ Tree) reflects what your process’s consumers cite as essential to success. This helps to clarify what a defect in the process is. It also helps to distinguish between your client’s needs and their requirements.
House of Quality: Quality Function Deployment (QFD) is a planning process for products and services that starts with the voice of the customer. Quality Function Deployment (QFD) is a structured approach for defining customer requirements and translating design specifications or product control characteristics into the form of a planning matrix.
Project Management
In Six Sigma project management, senior managers take an active role. They create projects by choosing a business process that is in need of improvement. However, a project manager–often a Six Sigma Black Belt – will usually lead the project itself.
There are three basic stages in Six Sigma project management:
- Planning: You work out what needs to be done to make the project successful.
- Scheduling: You map out how long your team will take to complete all the tasks.
- Controlling: You keep track of both of these factors throughout the project and adapt resources, planning, or scheduling so that it stays on track.
Project management tools aid an individual and a team in better project management, regardless of project size. The organization or project management team should have appropriate tools for effective project management. The project management tools help to standardize the work and make the project manager work efficiently.
Six Sigma Teams
Team dynamics refers to the force that inspires or drives a group of people to work collectively for a common cause or objective. A good team is a team with different personalities and also a common identity.
We use Stakeholder Analysis to identify people with a stake in our product. We use stakeholder analysis before we start planning a project. Why? Because we need to know who we need to be talking to and what we’ll need from them. Until we have that, we can’t create an effective plan. And we also need to plan our output. This affects what we’ll put into updates and when.
When you assemble a Six Sigma team, you want to merge individuals into a cohesive team that will work together. Understanding team growth stages can help you fast-track that process and keep it from derailing.
Summary of the Stages of Team Growth
According to Bruce Tuckman, there are five basic stages in a team’s evolution:
- Forming: Team members get to know each other and look for roles within the team.
- Storming: The team gets used to each other and starts to disagree and have conflicts.
- Norming: Team members accept their roles and begin to feel like a cohesive team.
- Performing: The team can both reach a consensus and act on that consensus as a group.
- Transforming: The team is breaking up because the project is nearly or completely ended.
Roles of Six Sigma Teams
There are a lot of potential roles in a Six Sigma team. Some of these are essential, full-time roles. Others will come and go at various stages in a project, as needed.
- Team Leader: Responsible for getting the team to go. Sometimes, a facilitator. Sometimes, the project manager.
- Facilitator: Usually a Black Belt or Master Black Belt. Coaches the team in Six Sigma practices.
- Scribe: Records the team activities.
- Sponsor: A business leader who sponsors the Six Sigma project. Will tend to set project objectives and obtain resources for the team. Often, there is a liaison between the team and senior management.
- Champion: Executive who sponsors a specific Six Sigma project. Ensures that resources are available. Resolves any cross-functional team issues. (Sometimes, this is the same as the sponsor. Different companies use different titles.)
- Six Sigma Leader: The executive responsible for the Six Sigma culture in the company.
- Process Owner: A person responsible for the business process targeted by a Six Sigma project.
- Team member: A person who will work on a project. Usually has specific skills that are relevant.
- Gatekeeper: Audits the deliverables. Check them against requirements.
- Management: Provides resources and motivation.
Also, see Six Sigma Roles and Responsibilities.
The PDCA cycle, aka ADeming wheel, Shewhart wheel, or Shewhart Cycle, is a continuous improvement practice of making a Plan, Performing an action, Checking your results, and then Acting upon what you have learned.
Project Planning Tools
Project planning is one of the critical phases in project management; it comes after the project initiation phase. It describes the objectives or outputs that are expected from the project to yield.
Work Breakdown Structure: A work breakdown structure is a critical deliverable that organizes the team’s work into a manageable section. In other words, it is a plan that expands the project or statement of work into a detailed listing of activities required to complete the project.
Program Evaluation and Review Technique (PERT): A PERT chart is a tool that shows the project as a network diagram. It represents events and activities in sequence in the network to determine the critical path. A critical path is the sequence of tasks that requires the greatest expected time.
Critical path method (CPM): CPM is the longest duration through a project network diagram. Moreover, CPM is very similar to PERT; both use overlapping methodologies.
Stakeholder Analysis: We use Stakeholder Analysis to identify people who have a stake in our product. Then, we classify those stakeholders to figure out the following:
- How to weigh their input at various stages.
- When and how to keep them informed.
Communication Plan: A communication plan is to direct the flow of information about a project consciously. Use a communications plan to ensure you’re talking to the right people at every project stage.
Project Tracking Tools
Organizations need strong project tracking tools to execute Six Sigma projects effectively. Project tracking tools are important because Six Sigma is based on projects. Find a problem, define it, measure it, analyze it, fix it, and then ensure the solution ‘sticks.’ If any single phase goes wrong, so does the whole project. Following are a few project tracking tools.
Gantt Chart: A Gantt chart is a project tracking tool. A Gantt chart is a bar chart representing the task’s duration against the time progression.
RACI Matrix: The most common project responsibility matrix tool that clarifies roles and responsibilities during project execution. It describes the participation of various roles in completing tasks or deliverables. RACI stands for Responsible, Accountable, Consulted, and Informed.
Project priority matrix: A project priority matrix is a project planning tool that helps your team determine where to put their strongest efforts.
Analytical Tools
The seven quality tools, check sheets, scatter diagrams, histograms, flow charts, Pareto charts, fishbone diagrams, and stratification, were good for data collection analysis. However, the new analytical tools allow for identification, planning, and coordination in finding a problem solution.
Affinity Diagrams: An affinity diagram is a good technique for identifying & displaying potential root causes for unfamiliar problems. Affinity diagrams help you organize ideas into meaningful categories by recognizing common groupings. This method helps you reduce large amounts of data into a smaller set.
Tree Diagram: A tree diagram helps you break down big concepts into progressively greater detail. The idea here is to break down a concept into its constituent pieces systematically.
Matrix Diagram: A matrix diagram displays relationships within a single group or amongst two, three, or four groups (Ex. project objective, methods, results, causes, people, etc.). It also provides information like the strength of relationships amongst the group, the roles played by various groups, etc.
Prioritization matrix: A prioritization matrix can help you to work out and negotiate priorities for a project. It can also be used to prioritize projects themselves, although opinions are mixed on whether this usage is a good idea.
Activity Network Diagram: The primary intent of creating an Activity Network Diagram is to create a flow chart showing the necessary tasks for a project in sequence order (including parallel and serial paths).
Define Phase Deliverables
- Identify problem statement
- Determine the project scope
- Conduct financial impact
- Establish project goals and form a team
- Determine project deliverables and milestones
- Project charter acceptance from management
- Define phase tollgate review
Important Videos of Define Phase (DMAIC)
Six Sigma Black Belt Certification Define Phase Questions:
Question: Which of the following tools is commonly used in the define phase of a project? (Taken from ASQ sample Black Belt exam.)
(A) Affinity diagram
(B) Control chart
(C) Failure mode and effects analysis
(D) Data collection checklist
Answer:
(A): Affinity diagram. This answer makes the most sense here. A control chart is generally used in the Control phase or evaluated in the measure phase. An FMEA would be used in the measure or improvement phases before designing a new process improvement. Also, a data collection checklist would be used in the measurement phase.
When you’re ready, there are a few ways I can help:
First, join 30,000+ other Six Sigma professionals by subscribing to my email newsletter. A short read every Monday to start your work week off correctly. Always free.
—
If you’re looking to pass your Six Sigma Green Belt or Black Belt exams, I’d recommend starting with my affordable study guide:
1)→ 🟢Pass Your Six Sigma Green Belt
2)→ ⚫Pass Your Six Sigma Black Belt
You’ve spent so much effort learning Lean Six Sigma. Why leave passing your certification exam up to chance? This comprehensive study guide offers 1,000+ exam-like questions for Green Belts (2,000+ for Black Belts) with full answer walkthroughs, access to instructors, detailed study material, and more.

Comments (6)
I think you have your proactive and reactive subheadings flipped under Voice of Client. As the examples listed under reactive are actually proactive.
You’re absolutely correct, Sami!
Updated. Thanks for the catch!!
Nice article; but Cost of Poor quality does not include preventive and apprisal costs. These two are part of ‘Cost of Good Quality”.
You’re absolutely right, and thank you for pointing that out!
In quality management, Cost of Poor Quality (COPQ) specifically refers to the costs that arise due to failures—both internal and external. This includes things like scrap, rework, returns, warranty claims, and loss of customer goodwill. On the other hand, prevention costsappraisal costs are considered part of the Cost of Good Quality, because they are incurred to ensure that quality is maintained and defects are prevented.
I’ve updated the article on the Define Phase of DMAIC to better reflect this distinction. For more details on this concept, you might find our dedicated article on Cost of Poor Quality helpful as well.
Thanks again for helping keep the content accurate and valuable!
are there any test practice questions for each DMAIC phase?
Hi Anu,
There are thousands of practice test questions inside the paid program. Happy to help you enroll!
Just reach out to me here.
Best, Ted.