Project management tools act as an aid to an individual as well as a team for better project management, irrespective of the project size. A project involves activities and tasks with a specified objective, starting and ending dates, and necessary resources. In other words, it is a temporary initiative that is agreed upon, planned, and executed to achieve a specific goal.
Project management includes project planning and implementation to achieve goals and objectives. The phases of project management are
- Initiating: Kickstart the process
- Planning: Deciding what to execute
- Scheduling: When to execute it
- Executing: Performing the task
- Monitoring and Controlling: Reviewing and ensuring the desired results
- Closing: Capturing lessons learned and collecting feedback
For effective project management, the organization or project management team should have appropriate tools; those are called project management tools. The project management tools help to standardize the work and make the project manager work efficiently. Many of these tools are part of quality improvement and quality control activities apart from project management.
Following are some of the project management tools
Project Plan
Project planning is one of the critical phases in project management; it comes after the project initiation phase. A project plan describes the objectives or outputs that are expected from the project to yield.
A good project plan will include project scope, strategy, cost-benefit analysis, project scheduling, major milestones, and a complete description of resources (including human resources) to carry out the project.
Resource allocation and project scheduling are the two different components of the project plan. A project schedule is important to run or perform the different tasks of a project. Each task has its own start date and end date. Scheduling helps to finish the project within the specified due date.
A project report is documenting all that happened during the tenure of the project. It helps to evaluate the project and also helps in forthcoming projects.
Work Breakdown Structure
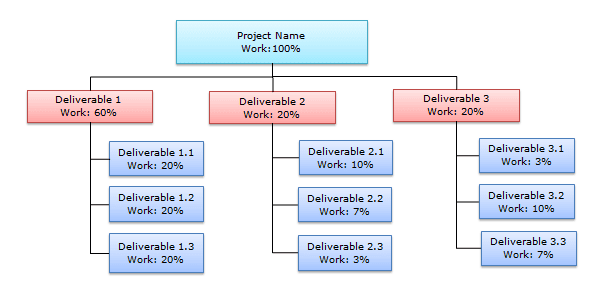
In project management and system engineering, a work breakdown structure (WBS) decomposes a project into smaller components. A work breakdown structure is a critical deliverable that organizes the team’s work into a manageable section. In other words, it is a plan which expands the project or statement of work into a detailed listing of activities required to complete the project.
The concept of a work breakdown structure is very simple. It breakdown complex tasks into smaller activities and then elements until reaching a point where it can no longer subdivide the tasks.
Once the workforce, material, and machines ascertain for each activity, the project network can be scheduled. Furthermore, it is a balance between a resource, time, and budget.
PERT
A Program Evaluation and review technique (PERT) chart is a tool that shows a project as a network diagram. The primary purpose of the PERT chart is to reduce the time and cost required to complete a project.
It represents events and activities in sequence in the network to determine the critical path. The critical path is the sequence of tasks that requires the greatest expected time.
The PERT chart’s biggest advantage is the critical path analysis can help identify the interrelationship between tasks and the bottlenecks/issues in the process. A PERT chart is to be used for non-repetitive, unique projects.
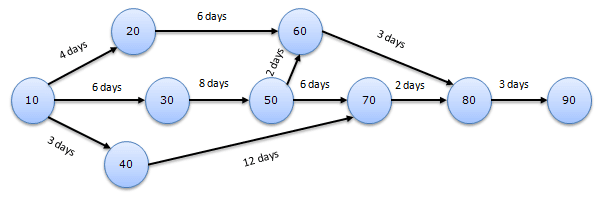
The critical path is the longest path of the network diagram:10-30-50-70-80-90.
CPM
The Critical path method (CPM) is the longest route through a project network diagram. In other words, completing the project requires the most time considering all the dependencies. CPM is very similar to PERT: both use overlapping methodologies. However, CPM is activity-oriented, and PERT is event-oriented.
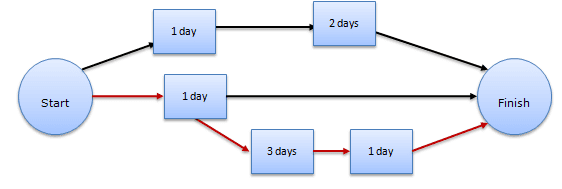
Critical path = 5 days
The critical path shows activities as nodes with arrows to show the logical links between them. If any of the critical path activity is delayed, it will impact total project delivery. There can be more than one critical path for a project, but having more than one critical path increases the risk. Because CPM can take cost into consideration, it can be more rigorous than PERT.
Gantt Chart
A Gantt chart is a graphical representation of the duration of tasks against the progression of time. Gantt chart typically outlines all the activities performed in a project in a systematic order to represent critical information and people assigned to each task. Henry Laurence Gantt developed Gantt Chart in 1910.
Gantt charts depict both the start and finish time of each task by showing where it is possible to have things happening simultaneously, which helps to plan resources appropriately.
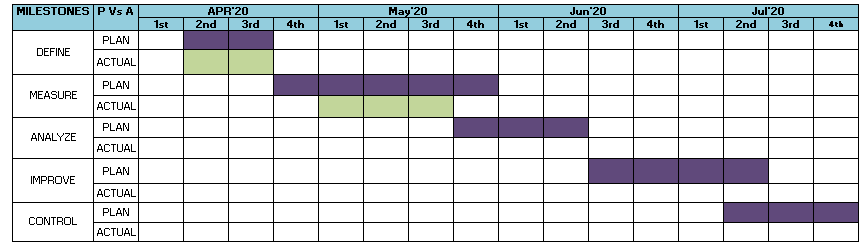
A Gantt chart is a tool to manage the project, and this helps to make the project schedule visible. Gantt chart presents the connection between activities and also the project flow. Milestone chart, Project bar chart, and activity chart are the other names of Gantt chart.
Project Documentation
Project documentation is one of the key aspects of the project management tool set. Document the methods of planning, monitoring, and controlling activities using a manual method like plain paper, colored magnetic makers, etc., or computer-based tools. However, these tools help to organize and summarize the data; the ultimate goal is to complete the project on time.
Milestones are important activities in the project which are planned to be completed at an explicit time period. Milestones need to review and approve by the stakeholders before it moves to the next milestone. Project leads need to prepare the document and share information covering any potential roadblocks or challenges with all the stakeholders.
The project report is the final report card, which covers project performance and benefits, and also captures lessons learned during the project. This will help as a guide for future projects for better planning and avoiding the same mistakes.
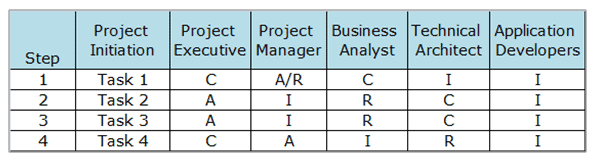
RACI
RACI chart is one of the simplest project management tools for planning and communicating the project. The RACI stands for Responsible, Accountable, Consulted, and Informed.
- Responsible: These are the individuals responsible for doing the task. There can be more than one individual to perform the task.
- Accountable or also known as Approve: This is the individual who is ultimately accountable for the work being done in a satisfactory manner. There should be only one individual who must sign off the work that is done by a responsible person.
- Consulted: These are the individuals whose input helps to perform the task. They can also be individuals who have relevant experience that can be valuable to the responsible and accountable.
- Informed: These are the individuals who are kept informed about the status of the task. Unlike other RACI interactions, this is one-way communication.
Process decision program chart (PDPC)
A process decision program chart (PDPC) is an extension to a tree diagram and a planning tool to identify risks and countermeasures for bottom-level tasks. In other words, the tool helps anticipate undesirable occurrences and prepare plans to neutralize their effect.
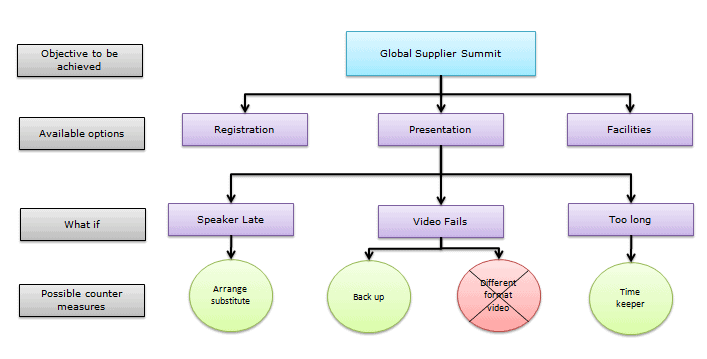
A PDPC chart is similar to failure mode effects analysis (FMEA). Both identify risks, consequences of failure, and contingency actions. Furthermore, the PDPC tool is useful when one wants to plan for all possible chains of events during a project. PDPC is used during decision-making, especially for new, unique, and complex projects.
Additional Helpful Links
Project Management Tools Videos
Also, see Project Tracking tools.

Comments (11)
Great study guide.
Thanks, Donald!
Why in Developing Project Metrics do you have Project Management Tools they are the not the same thing to me.
I agree with you Dan. I don’t see project metrics on this page. Where are you referring to?
It’s not there on the overview summary when you click developing project metrics you get program management tools.
GB Define: Define Phase of DMAIC Review Notes
Define Phase
Project Creation
• Selecting Lean Six Sigma Projects
• Building a Business Case & Project Charter
• Stakeholder analysis.
• Communication plan
• Developing Project Metrics
I see. Yes, you’re referring to inside the members area. I’ll get that updated.
https://sixsigmastudyguide.com/six-sigma-study-guides/iassc-six-sigma-green-belt-study-guide/
1.3.2 Developing Project Metrics
It is linked to this page.
What kind of project metrics would you like me to link to, Sumeet?
Update – we developed an entire page devoted to project management metrics.
Updating project management metric links to point to here.
Having the same problem as Dan, I am clicking the DEVELOP PROJECT METRICS and instead end up at PROJECT MANAGEMENT TOOLS everytime, broken link?
Updated on the course page. Thanks, Jeremy.