Many new Lean Six Sigma practitioners ask what a real project looks like in practice, especially in a healthcare setting. One of our SixSigmaStudyGuide.com students, Harpreet, recently shared a success story about improving hospital room turnaround times. Let’s take a look at her project and then explore how we might enhance it using a structured Six Sigma approach.
Harpreet’s Write-Up:
Background: I work in a rural community hospital who has seen increase in emergency department volumes and admissions from ED.
We also seen increase in ALC patients (ALC patients are the patients who no longer require acute care and are awaiting in hospital bed to be discharged to an appropriate destination) blocking beds. Our hospital has 35 surgical beds, 15 medical beds and 4 ICU beds. Total of 54 beds.
Problem: The tension of improving time to admitted patient length of stay has resulted in a blame problem which in my eye is a gap in process and clarity. It was often mentioned that housekeeping department hold the beds by not promptly cleaning it. Whereas housekeeping folks complained that they are not informed in timely manner or in advance about the discharges.
I also found that we do all the process by paper. There is no electronic way to track. We don’t have white boards. Staff was not taking staggered breaks resulting in periods when housekeeping staff was unavailable.
What I did: I started tracking room turn around times. I completed the process map, collected data. I completed fishbone diagram
What Changes I made: I educated housekeeping staff about the bed issues and how it is connected to performance. Staggered breaks to better coverage. Reviewed staffing
What I found: Reduction in mean time after tracking room turn around time”
First, congratulations to Harpreet on achieving a significant reduction in mean room turnaround time! Cutting the average room turnover from ~60 minutes to ~45 minutes is a big win. It means patients can be admitted sooner and the hospital can accommodate more patients overall. This kind of result has a direct impact on patient flow and satisfaction.
Project Approach: DMAIC or Quick Improvement?
First, congratulations to Harpreet! By applying Lean Six Sigma principles, she successfully reduced mean room turnaround times—an achievement that directly improves patient access and care. Helping a rural hospital better serve its community is a powerful application of continuous improvement.
Although this project leans heavily into Lean thinking by focusing on process clarity, waste reduction, and flow, it still fits well within the DMAIC framework. Harpreet defined the problem, measured the process, analyzed the causes using tools like a fishbone diagram, implemented changes, and observed measurable improvements. In the sections below, we’ll walk through how to structure this project even more formally, enhancing its impact and making it a potential model for future improvement efforts.
What follows are not criticisms. Harpreet is already doing fantastic work! These are suggestions to extract even more value from the work she has already begun
Define: Clarify the Problem and Goal
In the Define phase, we want to clearly articulate the problem, scope, and goals. Harpreet described the issue generally; slow room turnover causing admission delays and the improvement achieved.
Defining a clear, measurable problem and tightly scoped goal gives the team clarity and prevents confusion. It also enables alignment with leadership. To enhance this, we should write a formal Problem Statement and Goal Statement.
- Problem Statement: What is the pain point, in specific and measurable terms? For example (using hypothetical numbers): “Inpatient rooms are taking too long to turn over. Currently, the average turnaround time is 60 minutes (from patient discharge to room ready). This delays new patient admissions, causing an ER backlog and potential diversion of ~5 patients/week.”
- This statement defines the gap between current performance and desired performance, and it links to impact (patients waiting). A great problem statement avoids jumping to causes or solutions. It simply quantifies the issue and why it matter
- Goal Statement: What specific result are we targeting? Harpreet achieved ~45 minutes; perhaps the goal was “Reduce average room turnaround time from 60 to 45 minutes (a 25% reduction) within 3 months, to enable timely admissions and serve more patients per day.”
- Setting a SMART goal (Specific, Measurable, Achievable, Relevant, Time-bound) gives the team a clear target.
Why make these edits? A well-defined problem and goal align the team and stakeholders. It ensures everyone understands the gap to close (15 minutes improvement) and the benefit of closing it (e.g. more patients admitted, less ER backlog). Defining the project boundaries (which hospital unit, which process steps) also prevents scope creep.
According to Six Sigma best practices, the problem statement should quantify the current vs. desired state and avoid implying a particular cause or blame. In this example, we focus on the turnaround time metric and the downstream effect on admissions, without yet proposing how to fix it or who is at fault.
Risks if not addressed: Without a clear problem and goal, the project might wander or stakeholders might misunderstand its purpose. For instance, if we didn’t specify the current 60-minute baseline, one person might think 50 minutes is “good enough” while another expects 30 minutes. If we didn’t tie the problem to the impact on admissions, hospital leadership might not realize why this project is critical.
Lack of clarity can lead to solving the wrong problem or failing to recognize success. In short, skipping this step could result in misalignment and reduced support for the project.
Measure: Capture Baseline Performance
Once the project is defined, the next step is Measure. This means collecting data on the current process.
Lean Six Sigma projects depend on understanding performance quantitatively. Establishing baseline metrics allows teams to measure the effect of their changes.
Current Strength: Harpreet has already started tracking room turnaround times.
Suggestions:
- Translate the process to a function: Y= f(x)
- Primary Outcome Metric (Y): Mean room turnaround time (from discharge to room-ready)
- Supporting Process Metrics (Xs):
- Time from discharge to housekeeping notification
- Time from notification to cleaning start
- Cleaning duration
- Balancing Metric: Staff availability or coverage during peak hours
Risk of not making this change: Without these metrics, it’s hard to validate sustained improvement or identify whether further process issues remain hidden.
Additional Measure Phase Improvements
In my hypothetical numbers from the problem statement, Inoted the average was ~60 minutes, which is a great start. We can add more rigor by looking at the distribution and validity of the data:
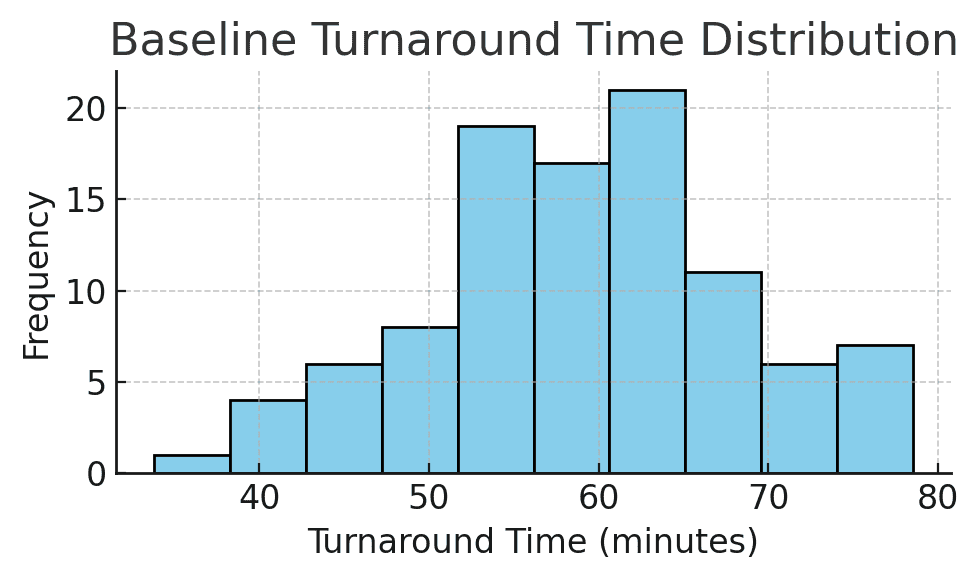
Figure: Baseline turnaround time distribution for patient rooms. This histogram shows the variation in room turnover times, with some rooms turned over in about 40 minutes, but some taking 70+ minutes. The average is around 60 minutes. Understanding the spread (min, max, common values) is as important as the mean.
- Data Collection: How was turnaround time measured? It’s important to define the start and end points of the metric (e.g. “from patient discharge in the system to room marked clean and ready”). In one other hospital project, the team found inconsistent recording. For example, some staff recorded the end time differently, skewing the data.
- Ensuring a consistent definition and measurement method (perhaps even doing a measurement system check) prevents garbage-in-garbage-out. For example, if half the staff weren’t stopping the clock until much later, the “60 minutes” figure might be inaccurate. We’d fix that early by training staff or automating timestamps.
- Baseline Metrics: In addition to the mean of 60 minutes, calculate other stats: median, range, standard deviation. How much variation is there day-to-day or room-to-room? Perhaps 25% of turnarounds are taking 80+ minutes (outliers), which is crucial information. Plotting a run chart or control chart of turnaround times over several weeks could reveal patterns (maybe certain shifts or times of day are slower).
- Process Mapping: It can help to map the process (e.g. patient discharge -> cleaning -> inspection -> ready). This isn’t about numbers but understanding each step and who is involved (nurses, transport, housekeeping). Harpreet did some of this by identifying coordination between nursing and housekeeping as an issue. A simple process map or SIPOC can ensure we consider all contributors to turnaround time.
Why emphasize Measure? Because decisions should be based on data. Baseline data is the foundation against which we’ll compare improvements. It tells us how big the problem really is and helps quantify the opportunity (e.g. “if we save 15 minutes per room, with 10 discharges a day, that’s 150 minutes saved, which is enough time to admit 3 more patients daily”).
Also, measuring variation highlights if the issue is consistent or sporadic. For instance, we might discover the median was 55 minutes but a few extreme delays pulled the average to 60, This could mean the problem might be a small number of very long turnovers. The Measure phase can also reveal root cause clues (like if nights are slower than days, etc.).
As one similar Six Sigma healthcare case study notes, “the baseline is important to compare with the improved results… Pinning down data collection early is essential for good decision-making and reliable data.” If we measure properly, we can later prove the improvement with confidence.
Risks if not addressed: If baseline data is not reliable or fully understood, the team might implement fixes that don’t actually move the needle or might miss the real problem. For example, if we didn’t catch inconsistent time logging, we might celebrate a “drop” to 45 minutes that was partly just a change in how times are recorded (a false improvement). Or we might average 60 minutes overall but fail to see that certain wards are 80+ minutes; our project might then ignore a specific bottleneck.
Skipping thorough measurement can lead to improvement efforts that are off-target or impossible to verify. We wouldn’t know for sure if we achieved success or if the process is statistically stable. In short, measuring poorly is like flying blind; you might land somewhere, but not necessarily at the intended destination.
Analyze: Identify Root Causes
Identify Remaining Waste and Barriers
Why: Lean aims to eliminate waste—anything that doesn’t add value to the customer (or patient, in this case). Identifying waste types can highlight hidden inefficiencies.
Suggestions:
- Waiting: Delay between discharge and housekeeping notification
- Motion: Manual paperwork creating unnecessary travel or effort
- Underutilized Talent: Staff unaware of how their role impacts flow
Risk of not making this change: Hidden inefficiencies can offset the gains already achieved, and the process may not improve further without addressing them.
With baseline data in hand, the Analyze phase digs into why the turnaround time was 60 minutes. Harpreet identified coordination issues between nursing and housekeeping; let’s broaden the analysis to be sure we find all major causes:
- Brainstorm Potential Causes: A classic tool here is the Cause-and-Effect (Fishbone) Diagram. Get the team (nurses, EVS cleaners, bed managers, etc.) together to list all factors that could slow down room turnover. Common categories to consider are People, Process, Equipment, Environment, Materials, Methods (Sometimes stated as the 6 M’s). For example, People might include staffing levels or training, Process might include unclear procedures or communication flows, Equipment could be availability of cleaning supplies or bed trackers, and so on.
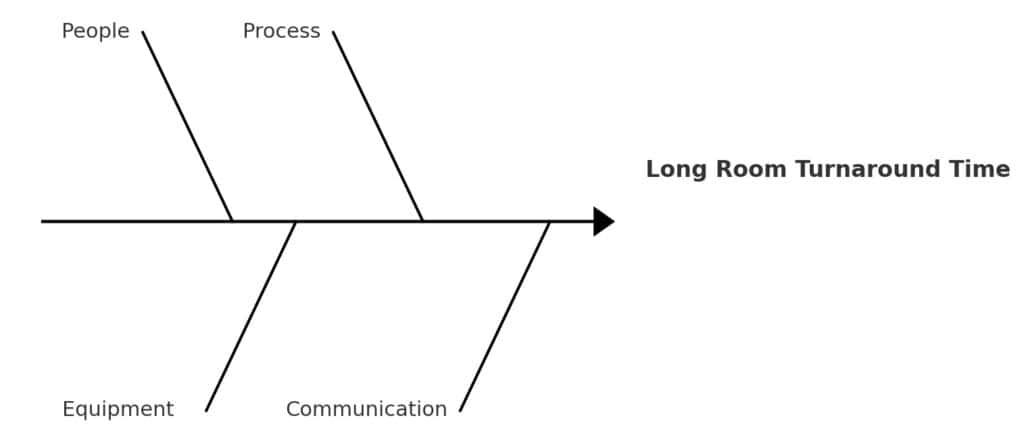
Figure: A simplified Fishbone Diagram for “Long Room Turnaround Time.” Major cause categories (people, process, equipment, communication) branch into specific issues. For instance, under People: insufficient housekeeping staff or nurses not notifying promptly; under Process: no standard protocol for “STAT” room cleaning; under Communication: delays in notifying EVS that room is ready to clean.
In Harpreet’s case, some root causes might have been:
- No formal STAT process: Perhaps housekeeping didn’t know when a discharge was high-priority. (Like it was in this case study)
- Communication gaps: The nurse might have marked the patient out in the system, but cleaners weren’t alerted immediately or had to be paged manually.
- Staffing or roles: Maybe at certain times, no dedicated housekeeping staff were on standby, causing waits.
- Standard work: Without a checklist or defined roles, cleaning could be inconsistent or slower than necessary (e.g. missing equipment, having to fetch supplies).
- Other factors: If transportation of patients or equipment (e.g. bed cleaning machines) is involved, delays there would add to turnaround.
Harpreet did implement a checklist and better coordination, which suggests these causes were at play.
During Analyze, tools like the fishbone and even a Pareto chart can help prioritize causes. For example, if we gathered data on reasons for delays (waiting for housekeeping, room not fully cleaned, waiting for maintenance, etc.), a Pareto chart might show that two causes account for 80% of the delay (say, housekeeping response time and waiting for transport). In an OR turnover case study, “hundreds of variables may impact turnover, so the team used a fishbone diagram to prioritize the most critical factors,” identifying that equipment and attendant availability were two major contributors. We would do similarly for room turns.
- Validate Causes: Wherever possible, back up cause hypotheses with data. If we think staffing is an issue, look at peak discharge times vs. housekeeping staffing levels. Eg Was there a spike at noon but only one cleaner on duty? If communication is a suspect, maybe logs show an average 15-minute gap from discharge to housekeeping dispatch. In other words, use process data or even observations to confirm that these factors are truly causing delay.
Why perform Analyze thoroughly? Because we want to fix root causes, not symptoms. It’s easy to jump to one solution (e.g., “just add more cleaners”) without realizing there’s a procedural fix (like using an automated alert to cleaners) that might be cheaper and equally effective. The analyze phase forces us to systematically consider and verify causes. Often, teams start with assumptions about the problem – Analyze helps challenge those assumptions. For instance, nurses might initially blame housekeeping, while housekeeping might blame late patient transport; analysis can reveal that both are issues, but communication is the bigger problem.
Risks if not addressed: If we skip deep analysis, we risk implementing solutions that don’t actually address the main delay drivers. Imagine if Harpreet had assumed the only issue was “housekeeping is slow” and just told them to hurry up? She might have missed that housekeeping wasn’t even notified promptly when patients left. The result could be little to no improvement, or a temporary band-aid that doesn’t last. Another risk is that without team input in analysis, you miss front-line insights and fail to get buy-in for solutions. Bypassing Analyze can also cause over-engineering: fixing things that aren’t really broken while neglecting the real bottleneck. In summary, not finding the true root causes means the improvements may only scratch the surface or target the wrong problem, and the original issue (slow turnarounds) will persist.
Improve: Implement and Validate Solutions
Prioritize Next-Level Changes
Why: Harpreet has already implemented several good changes. Further structured improvements can help lock in those gains and reduce variation.
Suggestions:
- Implement visual controls (e.g. whiteboards or printed status trackers) to improve communication
- Formalize standard work between discharge and cleaning
- Continue optimizing staggered breaks using peak demand data
Risk of not making this change: Improvements might plateau. If processes aren’t standardized, performance can vary between shifts or individuals.
During Improve, we design and implement changes to address the root causes identified. Harpreet already took action by coordinating between departments and using a checklist. These are excellent solutions. Here’s how we can maximize the Improvement phase:
- Develop Solution Ideas: Brainstorm multiple countermeasures for each major root cause. For example, if communication delay is a cause, solutions could include an automatic notification system (when nurse marks patient out, housekeeping gets an alert on their phone), or a direct phone/radio call process for STAT cleans. If lack of standard process is a cause, solutions might include a detailed Room Turnover Checklist (which Harpreet did) and training staff on it. If staffing at peak times is an issue, maybe adjust housekeeping schedules or have “float” staff. List all feasible ideas and then select the best ones based on impact and ease of implementation.
- Pilot and Implement: It’s wise to test changes on a small scale first. Perhaps start the new procedure on one hospital floor or shift for a week, gather feedback and timing data, then roll out hospital-wide. Harpreet’s introduction of a checklist could be piloted in one ward to ensure it indeed covers all tasks and is user-friendly. Similarly, a new communication protocol can be trialed during the busiest shift to work out kinks.
- Validate the Improvement: After implementing, measure the results to confirm the change worked. This is exactly what Harpreet did by noting the new average was 45 minutes. We should also look at the distribution again. Did the slowest outliers get much better? Did variation decrease? Using statistical tools here can be helpful if the data volume permits (for example, a t-test to confirm the mean time reduction is statistically significant, or a control chart to see the process shift).
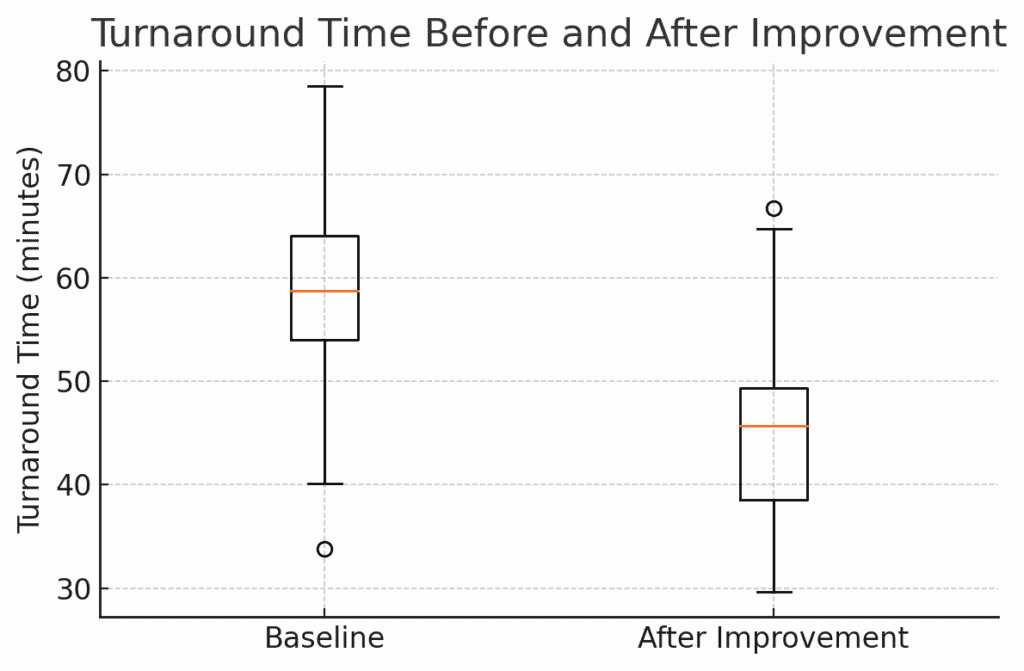
Figure: Turnaround Time Before and After Improvement. This boxplot shows the distribution of room turnover times for a sample of rooms before the changes (left) and after (right). The median dropped from ~58 minutes to ~45 minutes (orange line), and the spread of times narrowed. The improvement is clearly visible (the entire box has shifted down), confirming that the solutions had a strong effect.
In the boxplot above, not only has the average come down, but we also see fewer extreme long delays. This suggests our solutions addressed both typical cases and the occasional worst-case scenarios. Harpreet’s result of ~45 min average is a ~15 min reduction, which in a hospital means a lot. Those 15 minutes per room might translate to a capacity to serve a few more patients daily or reduce backup in the ER. We should quantify this benefit: e.g. if 10 rooms turn over each day, that’s 150 minutes saved per day. That’s like creating an extra 2.5 hours of room availability daily. That could easily be 2–3 extra patient admissions per day as Harpreet observed.
- Document the Changes: As improvements are implemented, update standard operating procedures (SOPs), checklists, or any policy documents. If a new software alert is used, ensure everyone is trained on it. Basically, incorporate the solutions into the normal workflow of the hospital. Harpreet’s checklist should become part of the routine room cleaning protocol for all staff going forward.
Why focus on these points in Improve? Because generating a range of ideas and piloting ensures we find an optimal solution, not just the first solution. It also engages the team. People are more committed to changes they helped design. Validating with data is crucial to prove that the improvement is real and not just a one-time fluke or placebo. As the DMAIC approach emphasizes, you compare the post-improvement data to the baseline to see the actual gains. This is our evidence that the problem is solved.
Risks if not addressed: If we implement changes without piloting, we might introduce new problems. For example, an automated alert system might spam housekeeping if not tuned, or a poorly designed checklist might slow cleaners down initially. Without measuring after, we might not realize that, say, we only improved to Fifty minutes on average, not the goal of 45 – leaving some potential gains on the table.
We also risk not capturing the full benefit: maybe the average went down but there’s still a lot of variation that another tweak could fix. If we don’t validate, we can’t confidently celebrate or know to adjust. Moreover, failing to document the new process could mean the improvements aren’t consistently followed (some staff might ignore the checklist if it’s not official). In summary, not thoroughly executing the Improve phase could result in partial improvement, unanticipated side effects, or difficulty sustaining the changes.
Prepare to Communicate Results
Why: Demonstrating improvement to leadership builds support and encourages further Lean work.
Suggestions: Create a simple before/after comparison table:
| Metric | Before | After |
|---|---|---|
| Mean Room Turnaround Time | [Insert baseline] | [Insert updated value] |
Include qualitative wins, like fewer communication complaints.
Risk of not making this change: Leadership may not understand the value generated by the project or may not support scaling it further.
Control: Sustain the Improvement
Plan for Sustainment
Why: Lean Six Sigma improvements must be maintained over time to create lasting change.
Suggestions:
- Assign a process owner responsible for weekly/monthly monitoring
- Create a visual dashboard for room turnaround times
- Hold periodic huddles to discuss trends and issues
Risk of not making this change: Improvements may erode as attention shifts. New staff may not follow the new process without training and accountability.
The final phase, Control, is about making the improvements stick and monitoring the process so it doesn’t revert. This is often where projects struggle. A great improvement is made, but six months later the metric slips back. We want to prevent that.
- Standardization and Training: Ensure that the new process (checklist, communication protocol, etc.) is standardized across all shifts and units. Train all relevant staff (existing and new hires) on the updated procedures. For example, include the room-turnover checklist in the orientation for new housekeeping staff and nurses. Make it easy to follow. Perhaps a laminated copy of the checklist is posted on each unit.
- Control Plan: Develop a simple control plan document that outlines what needs to be monitored and who is responsible. This might include: the KPI (room turnaround time) with a target (e.g. keep average <50 min), how often it will be measured (daily or weekly average, monthly report), and actions to take if performance starts slipping. It could also tie into existing hospital performance dashboards.
- Monitoring and Response: Track the turnaround times continually. A charge nurse or quality analyst might pull weekly reports of average turnaround time. If the times start creeping up toward, say, 55 minutes for two weeks in a row, that should trigger an investigation: Did a part of the process break down? Are there staffing shortages? Essentially, we establish triggers and a response plan so that the gains are maintained.
One useful tool here is a control chart or at least a run chart of the turnaround time over time:
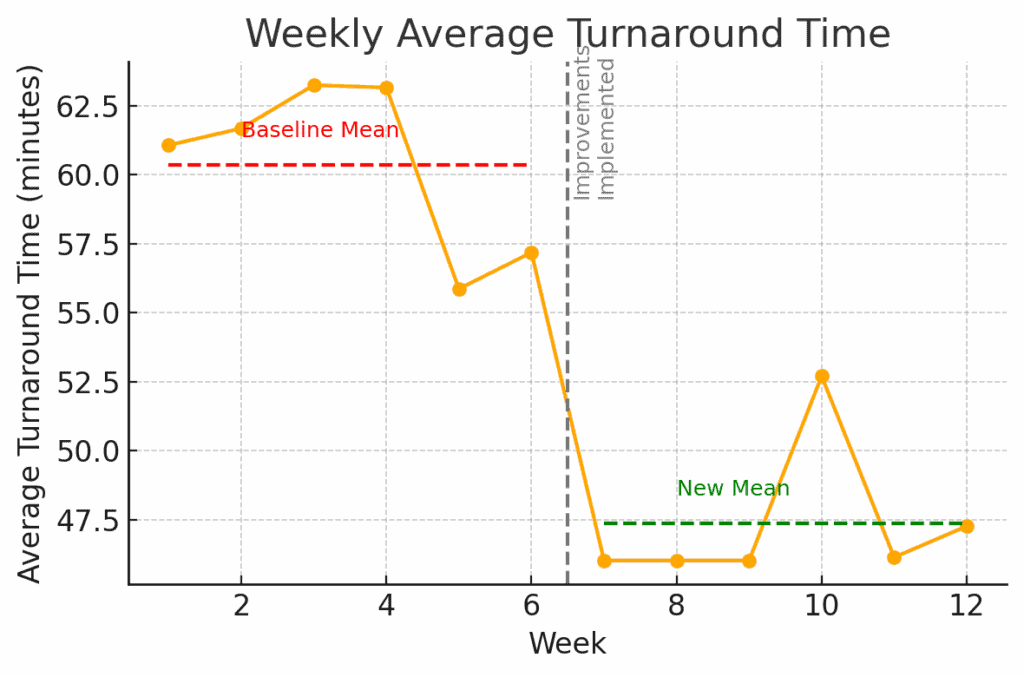
Figure: Weekly Average Turnaround Time after improvements. The orange line shows the average time per week. After Week 6 (when improvements were implemented, marked by the dashed line), the process mean shifts from about 60 min (red line) down to ~47 min (green line). This new level has been maintained for several weeks. A control plan would involve watching this chart going forward. I the line starts trending back up near 60 or beyond acceptable limits, it signals that we need to take corrective action.
In the chart above, we see a stable new performance. Control phase is about keeping it that way. That could involve Statistical Process Control charts, checklists, audits, or other means of verifying the process doesn’t slip. For instance, we might institute a monthly audit where a manager randomly checks 5 cleaned rooms against the checklist to ensure quality hasn’t dropped as speed increased.
- Assign Process Ownership: Identify a process owner (perhaps the Environmental Services manager or unit manager) who is accountable for this metric. That person ensures the control plan is executed. e.g., they review the data regularly and convene the team if performance declines. They also champion ongoing improvements (maybe the process can be improved further or simplified over time).
Why emphasize Control? Because improvement is not one-and-done. Maintaining gains requires vigilance. Humans naturally fall back into old habits, or new challenges emerge (like staff turnover, or higher patient volumes) that can strain the process.
The control phase makes the new way the default way, through procedures and monitoring. It also provides a safety net. If something starts to go wrong, it will be caught early. Think of it as maintaining a car after you’ve fixed it. You still need oil changes and a dashboard warning light in case of issues.
Risks if not addressed: If we neglect the Control phase, the hospital could quietly slide back to 60-minute turnarounds in a few months. Perhaps a key person leaves and the process knowledge is lost, or people stop using the checklist once the spotlight is off. Without monitoring, it might go unnoticed until patients are waiting again and someone asks “why are we slow again?” By that time, you’ve lost the gains and may have to restart a project.
Also, without control, small problems can snowball. For example, if the alert system fails one day and no one notices, it could introduce delays that become routine. In short, not having a control plan risks losing all the hard-won improvement, reducing trust in Lean Six Sigma, and missing opportunities to continuously improve further. As the saying goes, “trust but verify.” We trust our improvements, but we must verify over time that they remain effective.
Conclusion
Harpreet’s project is a terrific example of how Lean Six Sigma tools can make a real difference in healthcare operations. We walked through defining the problem in clear terms, measuring it with data, analyzing for root causes, implementing solutions, and then controlling to sustain the win. By applying these steps, we not only achieve the immediate result, but also ensure the hospital can maintain and build on that success. This means consistently faster admissions and more patients served without adding beds.
For students learning Six Sigma, it’s incredibly helpful to see a real-life project like this, end-to-end. It bridges the gap between theory and practice. And even for experienced practitioners, sometimes an outside eye or a structured review can reveal tweaks to get even more value from a project.
What do you think? If you have other suggestions for things Harpreet might try or analyze, please reply in the comments! Perhaps you have insight from a similar project – your input can help everyone learn.
Finally, if you’d like to see another detailed project walk-through in your industry (whether it’s healthcare, manufacturing, finance, etc.), let us know. I’m happy to do another case study breakdown for a student project. Having an example that hits close to home can be a powerful learning tool. Lean Six Sigma is a journey of continuous improvement, and we’re all in it together to share and grow.
When you’re ready, there are a few ways I can help:
First, join 30,000+ other Six Sigma professionals by subscribing to my email newsletter. A short read every Monday to start your work week off correctly. Always free.
—
If you’re looking to pass your Six Sigma Green Belt or Black Belt exams, I’d recommend starting with my affordable study guide:
1)→ 🟢Pass Your Six Sigma Green Belt
2)→ ⚫Pass Your Six Sigma Black Belt
You’ve spent so much effort learning Lean Six Sigma. Why leave passing your certification exam up to chance? This comprehensive study guide offers 1,000+ exam-like questions for Green Belts (2,000+ for Black Belts) with full answer walkthroughs, access to instructors, detailed study material, and more.
