

Welcome back to the 6 week Six Sigma Green Belt review!
Earlier this week we covered the Analyze Phase of DMAIC. We stepped through dozens of related concepts. You can see that here.
We also reviewed what some of the most popular certifying organizations like ASQ, IASSC, and Villanova require you know about these topics.
Today we’re going to review some of the kinds of questions you may be asked on your exam around those topics.
Ready? Let’s dive in!
ASQ Six Sigma Analyze Phase Questions
Question: Positional, cyclical, and temporal variations are most commonly analyzed in:
(A) gage variation
(B) process performance
(C) process stability
(D) engineering tolerances
Answer: (B) Multi-vari charts. SPC or statistical process control (including run charts) help you monitor how an on-going process is performing., so options A and D are not correct. Cause and effect diagrams are concerned with root cause analysis, so option C is not correct
Question: A correlation analysis is used to provide a numeric value for which of the following types of relationships between two variables?
A) Random
B) Linear
C) Curvilinear
D) Causation
Answer: B – Linear. This is a definition of correlation analysis. You could easily rule out random, though – there is no relationship between random events. It would also be helpful to see the articles on correlation coefficient and regression analysis to see this in action.
Question: Which of the following terms is used to describe the risk of a type I error in a hypothesis test?
(A) Power
(B) Confidence level
(C) Level of significance
(D) Beta risk
Answer: (C) Level of significance. The null hypothesis is rejected if the p-value is less than the significance or α level. The α level is the probability of rejecting the null hypothesis given that it is true (type I error) and is most often set at 0.05 (5%).
We can reject Power as it makes no sense.
A confidence level refers to the percentage of all possible samples that can be expected to include the true population parameter. It is a type of interval estimate of a population parameter. Does not makes sense here.
Beta risk is a type 2 error, so we can ignore that option. Also see the guide to hypothesis testing.
Question: Which of the following is a commonly accepted level for alpha risk?
(A) 0.05
(B) 0.50
(C) 0.70
(D) 0.95
Answer: (a) 0.05 – Remember that alpha risk is the risk that we have incorrectly rejected the null hypothesis even though it is correct, one of the kinds of errors we can make. 0.05 alpha means that we are comfortable with a 5% chance of incorrectly rejecting the null. That is a common industry standard. Even if you didn’t know that, the other answers don’t make sense. At 50% you are basically flipping a coin! Also see the guide to hypothesis testing.
IASSC Six Sigma Analyze Phase Questions
Question: In an “X” Sifting exercises a Belt will use a(n) _______________ to assist in isolating families of variation that may exist within a subgroup, between subgroups or vary over time.
(A) Multi – Vari Chart
(B) Pareto Chart
(C) FMEA
(D) Shewhart Analysis
Answer: (A) Multi – Vari Chart. This is by definition. The Mulit-vari chart helps you isolate variation inside a subgroup. Also see Pareto chart, FMEA, and Shewhart analysis.
Question: When conducting Hypothesis Analysis a Belt must use the formula shown to determine if a certain value is between -1 and + 1 which will lead to a conclusion relative to the hypothesis. The value calculated by this formula is the ____________ .
(A) Proportion of +/- 2 Standard Deviations to the total spread of the hypothesis data.
(B) Population Correlation Coefficient
(C) Sample Correlation Coefficient
Answer: (c) Sample Correlation Coefficient. This is a definition question. See article here: Correlation Coefficient.
Question: A battery manufacturer was considering changing suppliers for a particular part. The purchasing manager required that the average cost of the part be less than or equal to $32 in order to stay within budget. A sample of the 32 initial deliveries had a Mean of the new product upgrade price of $28 with an estimated Standard Deviation of $3. Based on the data provided, the Z value for the data assuming a Normal Distribution is?
A) 0.67
B) 1.33
C) 2.67
D) 4.33
Answer: 1.33 This is an easy algebra question. Z = (X – µ)/σ = 28-32 / 3 = 4/3 = 1.33. See Z Scores.
Question: When analyzing sample data a Belt may experience a Bimodal Distribution with each mode displaying Normal Distribution. This could be caused by _____________ .
A: Two different machines being read
B: Two operators on different shifts
C: Two suppliers parts being used
D: All these are correct answers
Answer: All of these answers are correct. If you see a bimodal distribution, you are most likely seeing a depiction of 2 different processes. 2 machines, supplier parts, operators, shifts could all ultimately be 2 or more distinct processes. See Bimodal.
Your Assignment
Assignment for everyone
A reminder that if you want to take these questions yourself you can via my online system. If you haven’t take then baseline exam yet, do so. You can find one available in all of my courses both paid and free.

As great as the baseline practice exams aren’t enough. You need to find more questions.
Your assignment this week is to find and practice more questions for these topics.
Assignment for PYSSGB Students
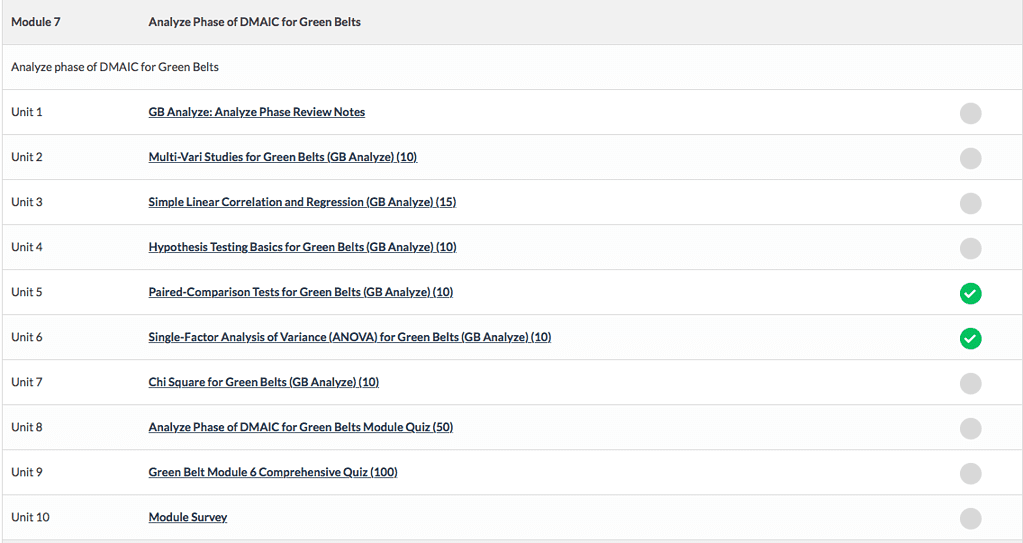
If you are a Pass Your Six Sigma Green Belt member, take all of the individual topic quizzes as well as the the cumulative exams for Module 7. Let me know what you think. (Want to be a member? Sign up here.)
What Do You Think?
I’d love to know what you think about the material you need to know in these sections. Please take a minute to share your thoughts below. I’ll use these responses to decide the best way to improve the site to help the most number of people.
Next Time
Next week we will dive into the Improve and Control Phases of DMAIC.
I’d love feedback on how you thought the second week went. What was good, what could be better?
Happy studying, Ted