Concrete is the backbone of modern construction. But what happens when the quality of cement begins to fail, and the concrete doesn’t set on time? This isn’t just a nuisance. Delays can cause costly project delays, quality issues, and even safety risks.
Introduction: A Hypothetical DMAIC Case Study Inspired by Readers
This article presents a hypothetical Six Sigma case study on delayed setting time of cement in concrete, structured using the DMAIC (Define, Measure, Analyze, Improve, Control) methodology. It was inspired by a question from a reader of the SixSigmaStudyGuide.com newsletter.
If you’d like to see a fictional Six Sigma case study tailored to your industry or challenge, contact us here. We welcome reader submissions and topic requests!
Why Setting Time Matters
When the Foundation Refuses to Set
Think about baking bread. Once the dough is mixed, you expect it to rise and firm up within hours. But what if the dough just sat there, staying sticky and unformed all day? Your kitchen schedule would collapse: no bread for dinner, wasted ingredients, frustrated guests.
That’s exactly what happens on construction sites when concrete takes too long to set.
Normally, concrete starts firming up in 2–4 hours and is ready for finishing in 4–6 hours. But when delays hit, entire projects stall. The ripple effects can be huge:
- Crews and machines sit idle, burning money.
- Timelines stretch, throwing off dependent tasks.
- The material itself may lose strength, risking quality.
- Companies even face penalty clauses for late delivery.
In Six Sigma terms, delayed setting isn’t just a materials problem, it’s a process problem. And process problems, no matter the industry, always cascade into cost, quality, and customer trust.
Definitions
Setting time refers to the period between when water is added to cement and when the concrete begins to harden.
- Initial setting time: When concrete begins to lose plasticity (typically 2–4 hours).
- Final setting time: When concrete is hard enough for finishing (typically 4–6 hours).
Delays in setting impact projects by:
- Increasing idle labor and machinery costs
- Delaying finishing and curing schedules
- Jeopardizing strength development
- Triggering penalties for late delivery
Define Phase: Framing the Problem
On a large construction site, engineers noticed that concrete batches were taking 8–12 hours to set instead of the expected 4–6 hours.
Imagine running a kitchen where dinner is supposed to be ready in four hours, but many nights, the meal doesn’t leave the oven until twelve! That’s what engineers were facing on a major construction project.
Concrete that should have set firm in 4–6 hours was instead taking 8–12 hours. The ripple effect was brutal:
- Crews waited around while mixers sat idle.
- Schedules slipped.
- Costs crept higher every day.
The team defined the challenge clearly:
- Problem statement: Concrete batches were setting far too slowly, leading to delays, rework, and ballooning expenses.
- Business impact: Labor costs rose by 15%, penalty clauses loomed, and client confidence began to erode.
- Project goal: Bring setting times back to standard (Initial: 2–4 hours; Final: 4–6 hours) within three months.
To tackle it, they formed a cross-functional improvement squad:
- Quality Manager (Black Belt): Project lead and problem-solving expert.
- Site Engineer (Green Belt): On-the-ground process insights.
- Materials Lab Technician: Technical analysis of cement and mix.
Measure Phase: Collecting the Data
The first step was to measure the problem with precision. Over four weeks, the team tracked 50 concrete batches, recording not just when each batch set, but also the conditions that might be influencing it:
- Initial and final setting times (measured with the Vicat apparatus, the industry’s stopwatch for concrete).
- Water-to-cement ratio.
- Admixture dosage.
- Ambient temperature.
- Cement supplier.
When the numbers came in, the picture wasn’t pretty:
| Metric | Average | Target |
|---|---|---|
| Initial Setting Time | 6.5 hours | 2–4 hours |
| Final Setting Time | 11 hours | 4–6 hours |
| Batches Out of Spec | 40% | < 5% |
Visualizing the Problem
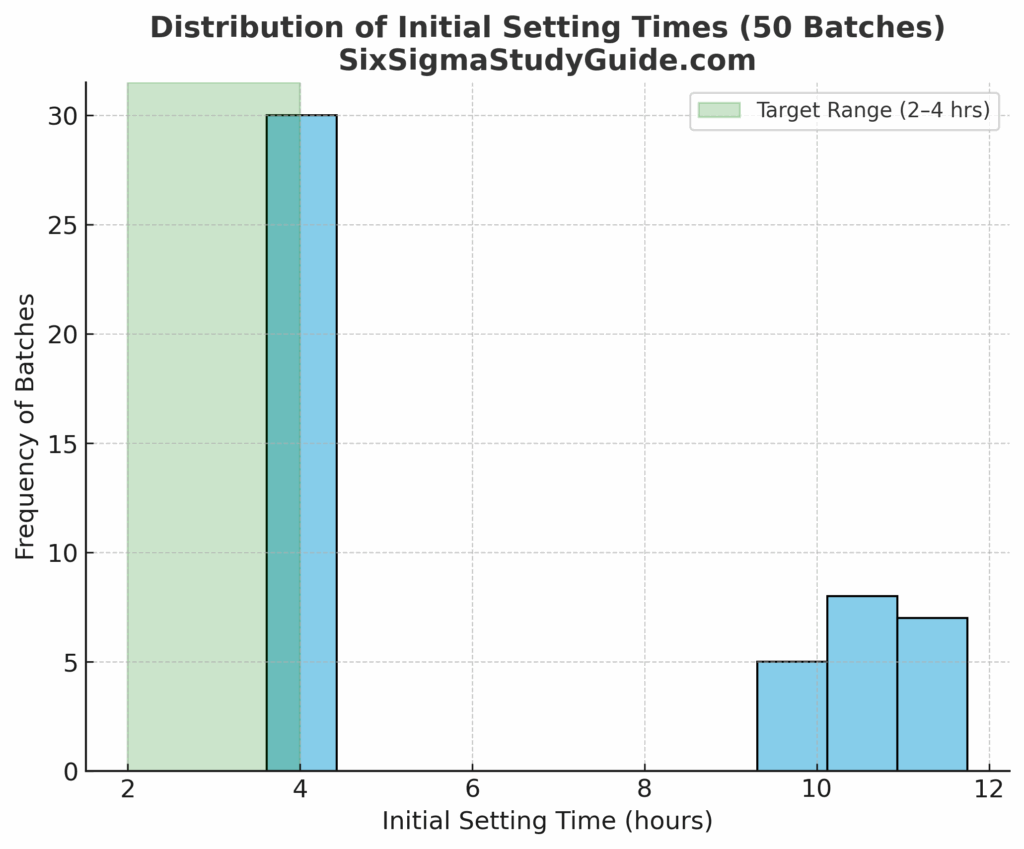
Numbers alone can feel abstract, so the team plotted all 50 batches on a histogram. The picture made the issue clear at a glance: instead of clustering tightly within the 2–4 hour target range, most batches sprawled between 6 and 12 hours. Nearly half were well outside specification, underscoring the urgency to act.
Measurement System Analysis (MSA)
Before acting on the data, the team first asked: Can we trust the measurements?
They conducted a Gage Repeatability & Reproducibility (Gage R&R) study using the Vicat apparatus, the standard tool for measuring cement setting times. The test involved:
- 3 operators (different technicians)
- 10 samples (batches of cement paste)
- 2 trials per operator
The goal was to confirm that variation in results came from the process itself — not from inconsistent measurement.
Results (simplified):
| Source of Variation | % Contribution | Acceptable Threshold |
|---|---|---|
| Repeatability (equipment variation) | 2.1% | <10% |
| Reproducibility (operator variation) | 2.3% | <10% |
| Total Gage R&R | 4.4% | <10% |
| Part-to-Part Variation | 95.6% | — |
✅ Conclusion: With less than 5% total variation due to measurement error, the system was considered reliable and fit for purpose.
This gave the team confidence that the wide spread of setting times observed was real — not just noise from the testing method.
Measurement Phase Findings
✅ The good news: The measurement system itself was solid (validated with less than 5% variation).
❌ The bad news: Nearly half (40%) the batches were wildly off target.
Analyze Phase: Finding Root Causes
Once the data was in, the team asked the most important question: Why is the concrete taking so long to set?
They applied a mix of Six Sigma tools to peel back the layers:
- Fishbone diagram: Brainstormed potential culprits, from raw material quality to storage conditions.
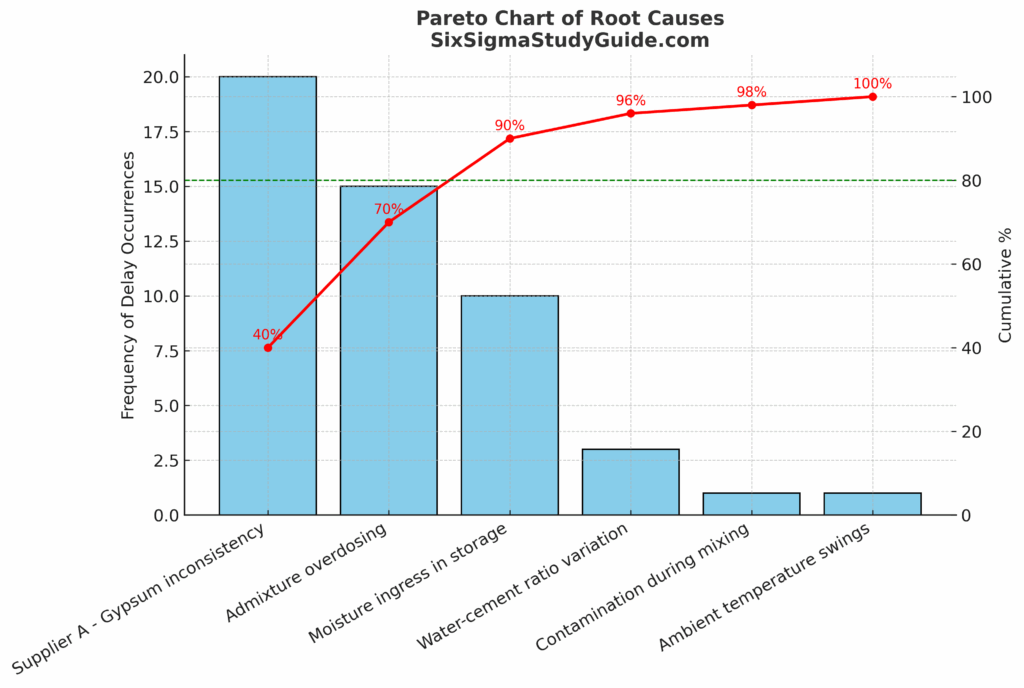
- Pareto chart: Showed that 70% of delays could be traced back to just two factors: a single cement supplier and mistakes with admixture dosing.
- Regression analysis: Confirmed that overdosing on superplasticizer (a chemical that improves flow) was directly linked with longer setting times.
- ANOVA test: Cement from Supplier A was statistically more delay-prone (p < 0.05).
Root Causes Identified
- Supplier A’s gypsum inconsistency — too much or too little gypsum throws off hydration chemistry.
- Admixture overdosing — poor dispenser calibration meant batches were getting far more superplasticizer than intended.
- Moisture ingress in cement bags — storage conditions allowed dampness, weakening reactivity before mixing even began.
📊 Visual Insight: A Pareto chart ranking delay contributors showed these three factors towering above the rest, classic “vital few vs. trivial many.”
Regression Analysis: Linking Chemistry to Delays
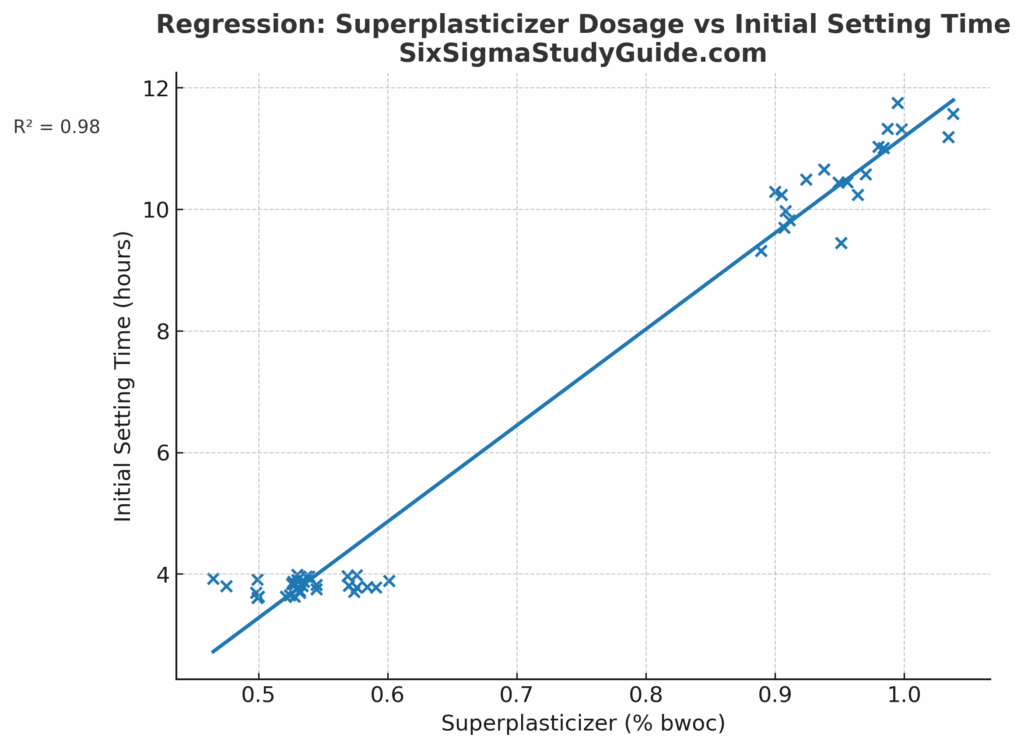
To move from suspicion to proof, the team turned to regression analysis. They plotted superplasticizer dosage (a chemical that helps concrete flow) against initial setting times. The result was unmistakable: as dosage levels crept higher, setting times stretched longer.
The regression line told the story quantitatively, with an R² of 0.98, a near-perfect correlation (aren’t fictional case studies amazing!?) In plain terms: the more chemical added, the longer crews had to wait.
Improve Phase: Implementing Solutions
Armed with clear root causes, the team moved from analysis to action. Their improvements tackled problems at the source:
- Supplier switch: Moved to Supplier B, whose cement had verified and consistent gypsum content.
- Calibration fixes: Admixture dispensers recalibrated to prevent overdosing.
- Storage overhaul: Standard operating procedures (SOPs) enforced — pallets to keep bags off damp ground, waterproof covers to block moisture, and FIFO (first-in, first-out) rotation to keep inventory fresh.
- Training: Every site engineer retrained on proper admixture usage.
- Daily QA checks: Added real-time monitoring of setting times on critical structures.
Post-Improvement Results
| Metric | Before | After |
|---|---|---|
| Initial Setting Time | 6.5 hrs | 3.8 hrs |
| Final Setting Time | 11 hrs | 5.5 hrs |
| Batches Out of Spec | 40% | <5% |
✅ In less than three months, the project flipped from chronic delays to predictable performance.
Visualizing the Turnaround
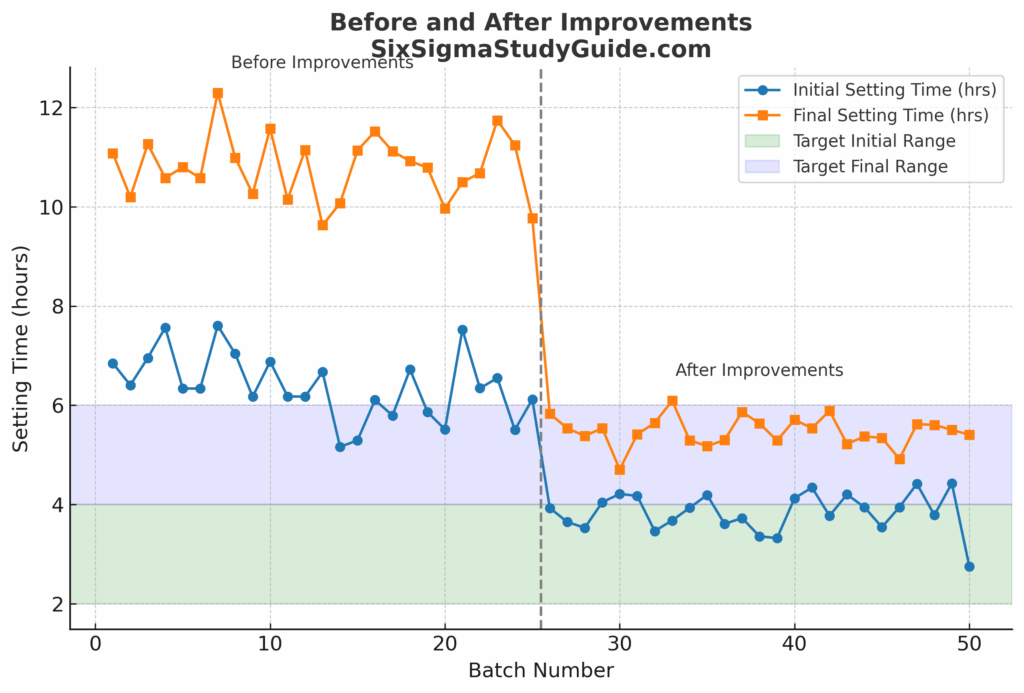
Data told the story better than words. In the first 25 batches, setting times hovered well above target, often stretching to 11 hours. After the improvements, the next 25 batches fell neatly back into the 2–4 hour initial and 4–6 hour final target ranges. The line chart made it obvious: disciplined changes created an immediate, lasting shift.
Control Phase: Sustaining the Gains
Fixing the problem was only half the battle. The real test was making sure the process didn’t slide back into old habits. To lock in the improvements, the team put guardrails in place:
- Supplier oversight: Quarterly audits to ensure cement quality stayed consistent.
- Stronger QA protocols: Routine checks for setting time and compressive strength.
- Control charts: Ongoing tracking of setting times to spot drift before it became delay.
- SOP reinforcement: Regular refreshers on storage practices and admixture handling.
Sustained Benefits
- ✅ 95% of batches within spec for three months straight.
- ✅ Project back on its original timeline.
- ✅ $250,000 in annual savings from reduced labor overruns and penalty avoidance.
📊 Visual Insight: The control chart of weekly setting times showed a stable, predictable process. No more long tails or nasty surprises.
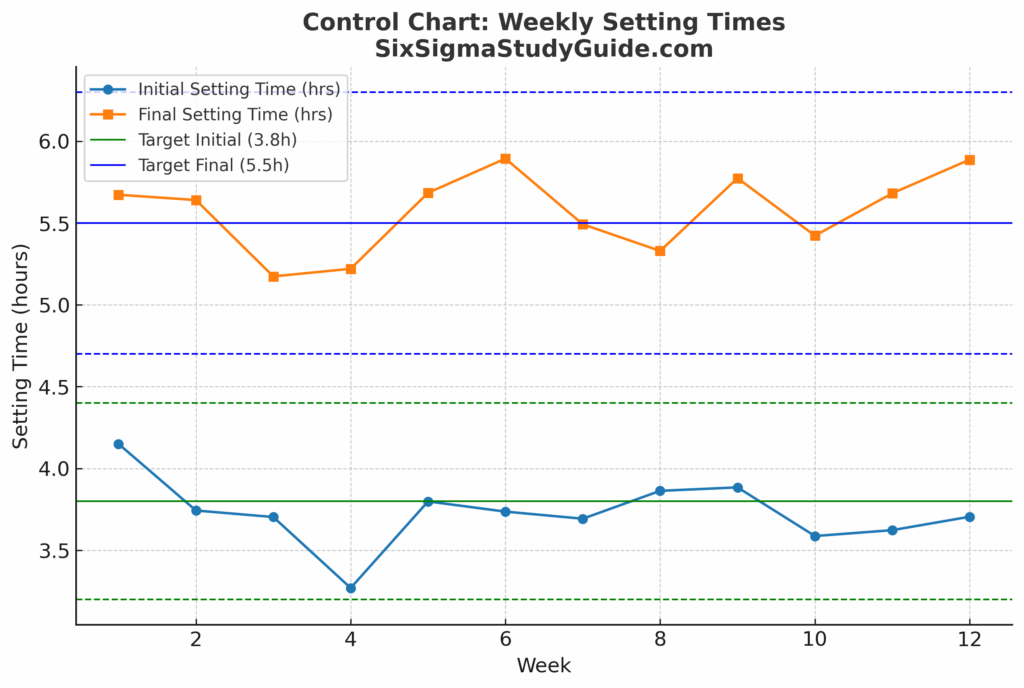
Keeping the Process on Track
After improvements, the team didn’t just “fix and forget.” Weekly tracking showed setting times staying well within control limits. That’s a clear sign that the process was stable, predictable, and under control.
Lessons Learned
- Supplier variation is critical. Certifications look good on paper, but consistency in quality is what keeps projects on schedule.
- Small mistakes create big delays. A slight overdose of admixture translated into hours of wasted time and added cost.
- Controls keep gains alive. Without ongoing monitoring, even the best fixes slip backwards.
💡 Pro Tip: Whether you’re in construction, finance, or tech, simple SPC tools (histograms, Pareto charts, and control charts) can flag issues early, before they spiral into crises.
Conclusion: DMAIC Delivers Results
By sticking to the Define, Measure, Analyze, Improve, Control framework, the project team turned a six-figure headache into a streamlined process. It’s a reminder that Six Sigma isn’t just for factories, it works anywhere processes, people, and performance intersect.
Got a challenge you’d like to see solved with Six Sigma? Submit a fictional case study request!
Best, Ted
When you’re ready, there are a few ways I can help:
First, join 30,000+ other Six Sigma professionals by subscribing to my email newsletter. A short read every Monday to start your work week off correctly. Always free.
—
If you’re looking to pass your Six Sigma Green Belt or Black Belt exams, I’d recommend starting with my affordable study guide:
1)→ 🟢Pass Your Six Sigma Green Belt
2)→ ⚫Pass Your Six Sigma Black Belt
You’ve spent so much effort learning Lean Six Sigma. Why leave passing your certification exam up to chance? This comprehensive study guide offers 1,000+ exam-like questions for Green Belts (2,000+ for Black Belts) with full answer walkthroughs, access to instructors, detailed study material, and more.

Comments (2)
This is a great job!
It is relevant to resolve concrete setting issue.
Welldone
Thanks for the kind words, Omotoso! And thank you for the suggestion!