Multi-vari charts help you to identify sources of variation. Use these charts to see within-piece, piece-to-piece, and time-to-time variations.
Multi-vari vs. other chart types
Stem and Leaf Charts, Histograms, and Frequency Distributions are all snapshots of Process Variation. They cannot help you to figure out the source of that variation. Multi-vari charts, though, can.
Recap of variation sources
- Within piece: Variations within a single instance of a product. Also known as Positional Variation.
- Piece to piece: Variations that occur between different instances of the same product. Also known as Cyclical Variation.
- Time to time: Variations that occur at different production times. Also known as Temporal Variation.
Generate Clues with Multi-vari Charts. This technique is especially well suited for analyzing multiple sources of common-cause variation: within piece, piece to piece, time to time, and process stream to process stream.
Reducing Process Variation- Davis Bothe
Benefits of Using Multi-Vari Charts
A Multi-vari chart can:
- Show most of your variations.
- Assist you in breaking down the components of variation.
- Show all measurements recorded.
Guidelines for Creating Multi-Vari Charts
When creating Multi-vari charts, keep these points in mind:
- Numeric data: You need to be able to plot the effects of variations using mean values.
- Factors: Use a maximum of six factors.
- Levels: You need at least two levels for each factor.
- Amount of data: Collect observations for the majority of factor combinations.
Step to perform Multi-Vari chart
- Select the process that needs to be monitored and the characteristics to be inspected.
- Determine the sample size and time-frequency.
- Collect continuous data to ensure the output of process performance should be continuous.
- Define units–Output characteristic measurable multiple times.
- Collect the data (2 to 5 samples within a unit) and 3 to 5 consecutive units to ensure that the process is monitored long enough to understand.
- Multi-vari charts can be drawn by hand. Draw the chart on graph paper with time along the horizontal axis, then observe values on the vertical axis.
- Connect the observed values with appropriate lines.
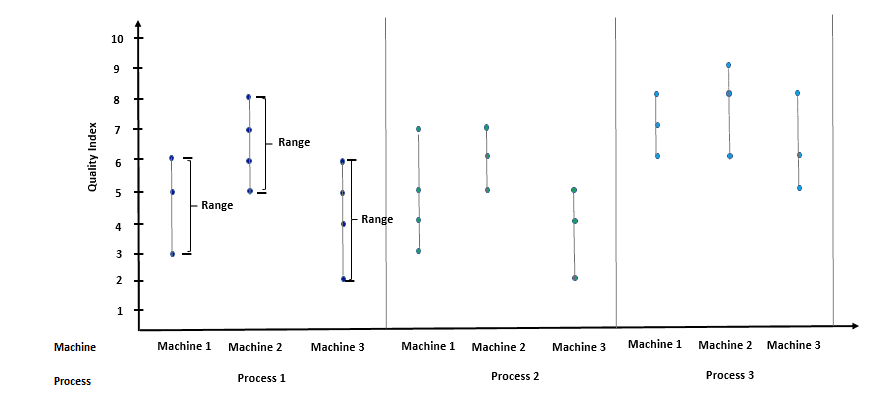
- Plot each measurement with a circle and then connect each measurement within each unit showing the variation’s magnitude. Compute the average within each unit and connect it with a line to the consecutive unit. We can also compute the range of each unit by subtracting the minimum value from the maximum value. Measure the overall average of all values and draw a horizontal line (for reference)
- Each temporal set can be divided with a vertical line
- Compute the overall average of each set and connect it with a line
- Finally, analyze the chart for variation both within the piece, from piece to piece, and from time to time.
- Repeat the same process of conducting Multi-vari study after the process improvements to confirm the results.
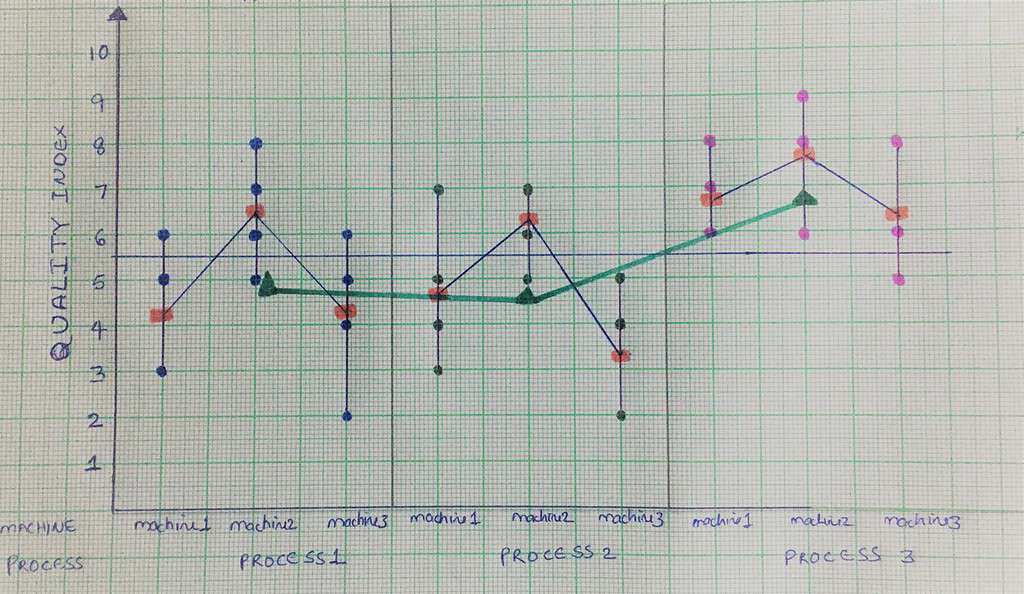
Creating a Multi-Vari Chart Manually
XYZ wants to assess the different machines and processes affecting the Quality Index.
Data Table
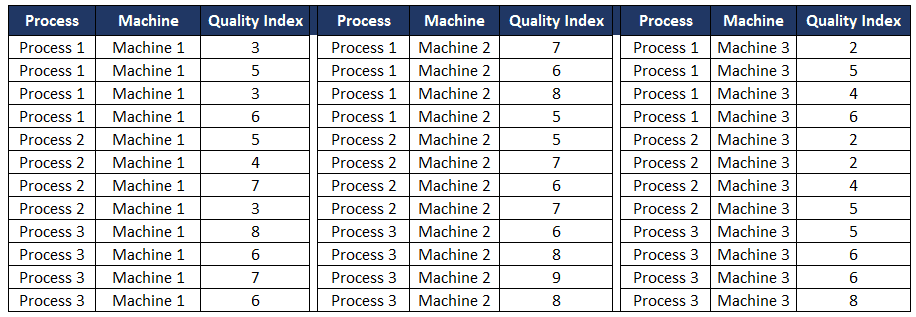
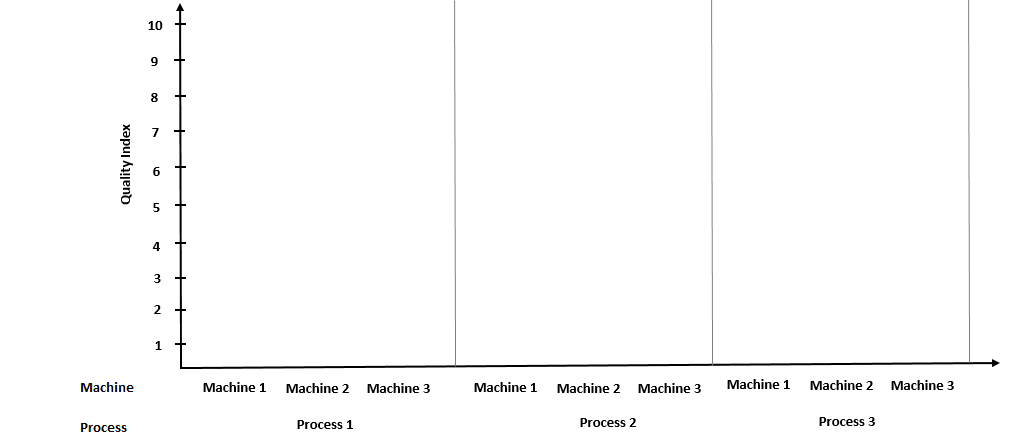
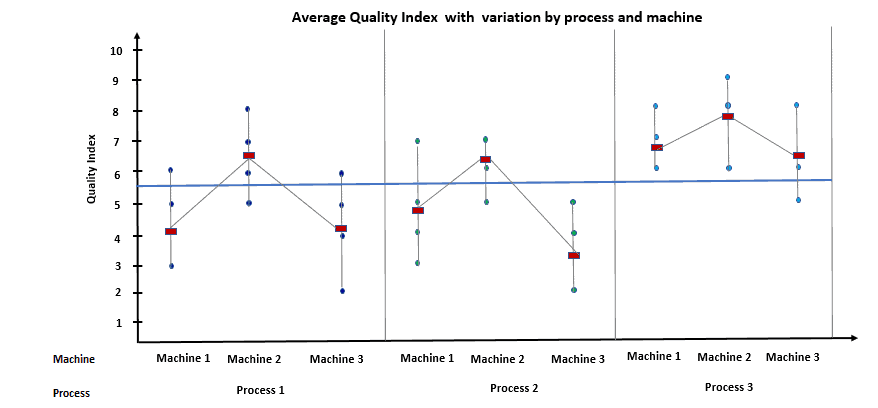
Draw the chart on graph paper with time along the horizontal axis and then Quality index values on the vertical axis.
Compute the average within each unit.
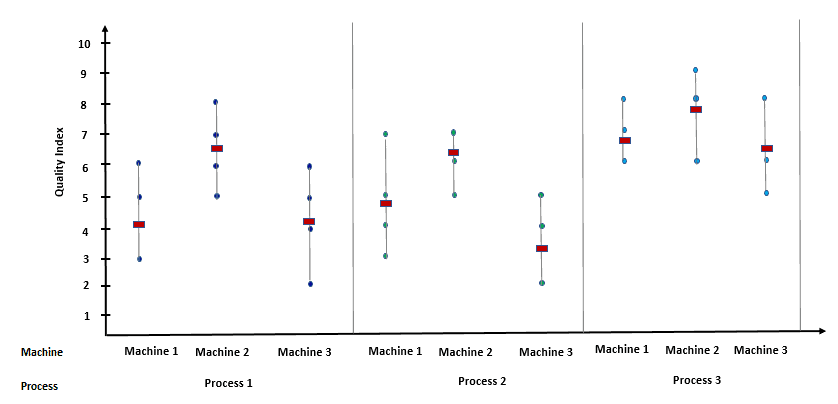
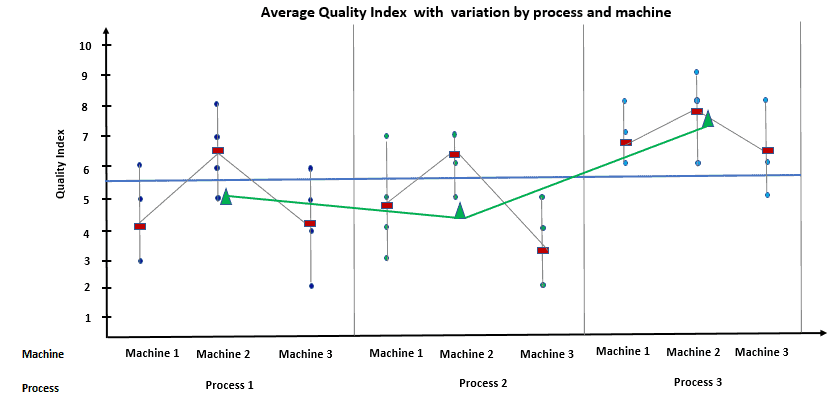
Compute the overall average of each set and connect it with a line (green line).
Interpret the results: Analyze the chart for variation both within the piece, from piece to piece, and from time to time.
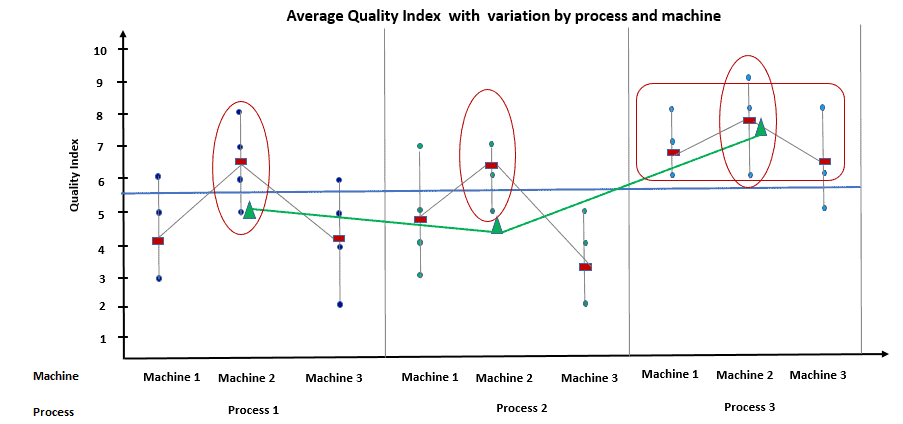
From the above graph, it looks like process 3 has higher overall averages and is also higher than the overall averages of all the measurements. Hence, process 3 is the best option. It looks like machine 2 has higher averages in all three sets.
Creating a Multi-Vari Chart using Excel
- Time is on the horizontal (x) scale.
- Variable measurement is on the vertical (y) scale.
Creating a Multi-Vari Chart using Minitab
Let’s walk through creating a Multi-vari chart using a basic baking problem.
Issue
I’m baking cookies using three different ovens. Some of my cookies seem a bit wider than others. I need to figure out why. They’re all made from the same ingredients and recipe. So I think the most likely factors are:
- Placement on the cookie sheet. (within-piece, treating each sheet of cookies as a ‘piece’)
- Temperature variations between ovens. (piece-to-piece)
- Temperature levels in the kitchen when the cookies are being mixed and added to sheets. (time-to-time)
Therefore, I’ll use these three factors in my chart.
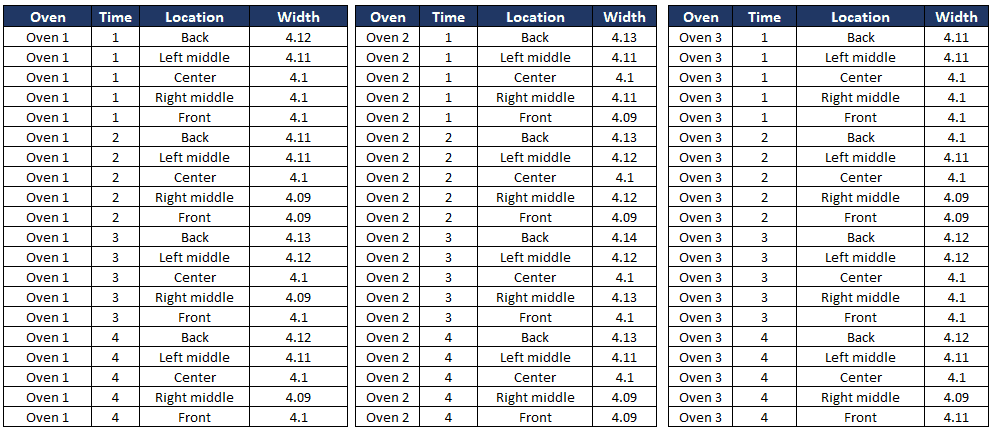
Data table
First, I need to take width measurements on every cookie. I also need to record:
- The oven it was baked in.
- The batch it was part of.
- The location on the cookie sheet.
Next I filled out this data table:
Chart
To turn the data table into a chart, I use Minitab.
I copy and paste my table into its spreadsheet. I then select Stat > Quality Tools > Multi-Vari Chart from the menu.
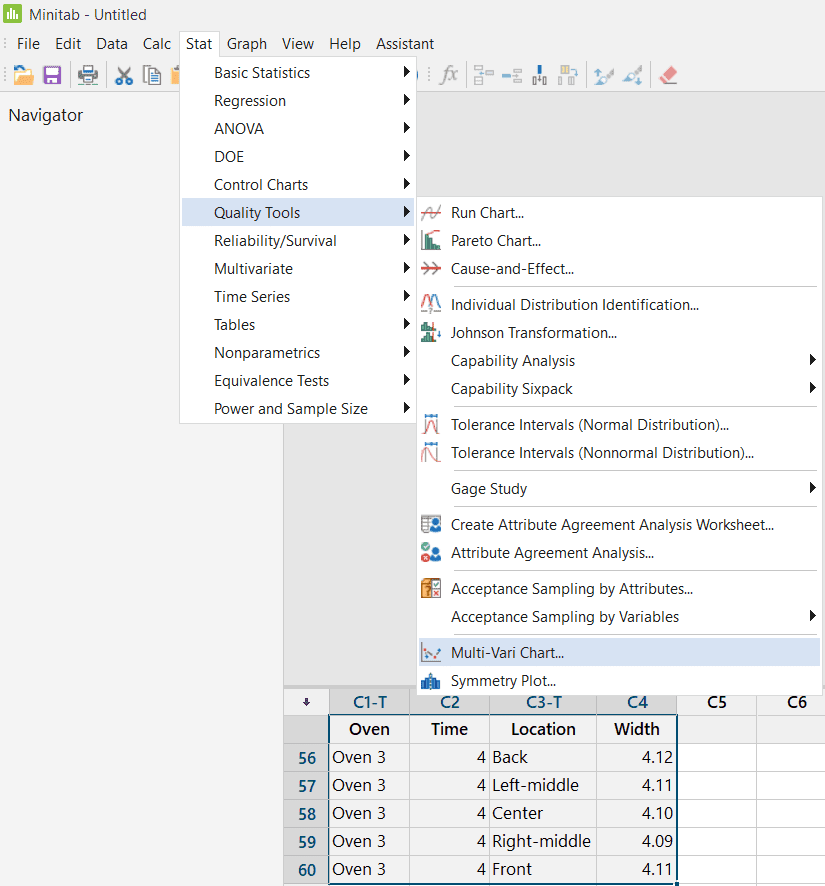
I tell Minitab which column has my results (Response). Then I select my variables (Factors 1 to 3).
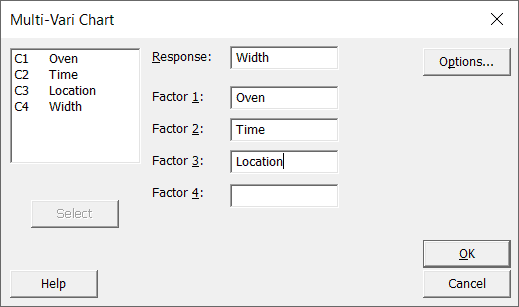
I click on OK.
Minitab created the chart for me.
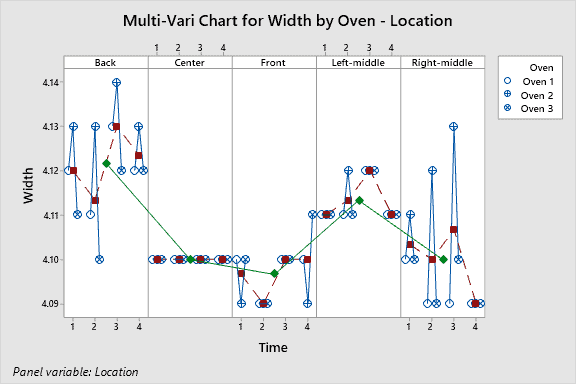
Interpreting the Results
One thing immediately jumps out when I look at this chart: the center measurements are perfect. In every other oven location, though–back, front, left middle, and right middle–the measurements for Oven 2 are substantially skewed from Oven 1 and 3.
I can probably remove a lot of variation by servicing or repairing Oven 2.
How to Solve a Multi-Vari Chart Question by Hand
When you don’t have access to tools like Minitab (like in the middle of a Six Sigma Black Belt Exam!), you can still analyze multivari data manually. Here’s how to determine which factor — like Tunnel Temperature or Shift — causes more variation in a process.
Additional Helpful Multi-Vari Videos
Complimentary information to Multi-Vari Study, Multi-Vari Charts
Also, see:
Find further information and examples in this PDF: Multi-Vari Analysis.
Six Sigma Green Belt Certification Multi-Vari Study, Multi-Vari Charts Questions:
Question: In an “X” Sifting exercise, a Belt will use a(n) _______________ to assist in isolating families of variation that may exist within a subgroup, between subgroups, or vary over time.
(A) Multi – Vari Chart
(B) Pareto Chart
(C) FMEA
(D) Shewhart Analysis
Answer:
Six Sigma Black Belt Certification Multi-Vari Study, Multi-Vari Charts Questions:
Question: Positional, Cyclical, and Temporal variations are most commonly analyzed in
(Taken from ASQ sample Black Belt exam.)
(A) SPC Charts
(B) Multi-vari charts
(C) Cause and Effect Diagrams
(D) Run Charts
Answer:
When you’re ready, there are a few ways I can help:
First, join 30,000+ other Six Sigma professionals by subscribing to my email newsletter. A short read every Monday to start your work week off correctly. Always free.
—
If you’re looking to pass your Six Sigma Green Belt or Black Belt exams, I’d recommend starting with my affordable study guide:
1)→ 🟢Pass Your Six Sigma Green Belt
2)→ ⚫Pass Your Six Sigma Black Belt
You’ve spent so much effort learning Lean Six Sigma. Why leave passing your certification exam up to chance? This comprehensive study guide offers 1,000+ exam-like questions for Green Belts (2,000+ for Black Belts) with full answer walkthroughs, access to instructors, detailed study material, and more.

Comments (10)
Hello,
The video for creating a Multi-Var table is no longer available. Can we get this updated?
Thanks, Mike.
I’ve replaced that video with another and also added another helpful video at the end.
Best, Ted.
Ted dear,
for IASSC exam am i allowed to use any tool like sigma or minitab, and originally is it common (if you any clue) that IASSC asks question that requires to plot the data using any tool ?
many thanks
Hi Ahmed,
My understanding is that IASSC only allows you to have the approved equation sheet on exam day.
Best, Ted
Why cant we use a box plot for this kind of scenario ? Since we have one common independent variable across all sub groups? Pictorial representation of box plot will give better clarity about the scenario.
Box plots are great (see here). Extending them to handle more than 2 dimensions gets tricky, quickly (reference). If you really want to try, here are some interesting graphical treatments.
Is there an updated link to the pdf with more multi vari examples? I was not able to find a download from the link provided. Thank you
Everything we have is published here, Ross. We do have some updates planned in the future, so stay tuned.
Can you give me a hand?
I’d like to get some raw data table about using a basic baking problem.
How can I best help, Jon?