Maintaining solutions is one of the key activities in the Control Phase to ensure the new process is implemented and doesn’t revert to old ways. When maintaining solutions, the type of control you should use is primarily determined by where your process is located on the standardization/throughput matrix.
The main objective of the Control phase is to measure the new process characteristics and validate the improvements. This involves implementing control and response plans to ensure strict adherence to the new process. Additionally, it aims to institutionalize the improvements by developing procedures and work instructions and transitioning the improved process to the operations team.
Hence, before maintaining solutions (creating efficient work instructions or procedures), it’s essential to understand where your process stands on the standardization/throughput matrix. In other words, you need to figure out how standardized and efficient your process is before you can improve it with clear instructions.
Process Throughput
Process throughput refers to the rate at which an organization can produce, deliver, or service a certain amount of work within a given period. Furthermore, process throughput is measured in terms of output per unit of time—for example, products manufactured per hour or tasks completed per day or week.
A high throughput indicates the system has efficient use of resources and a smooth workflow, while a low throughput indicates bottlenecks or inefficiencies within the operating process.
Example: A restaurant makes hashbrowns. The kitchen has a large griddle that can cook 20 hashbrowns at a time, and it takes 15 minutes to cook a batch of hashbrowns.
So, the process throughput would be 20 hashbrowns per 15 minutes or 80 hashbrowns per hour. In other words, the restaurant can produce 80 hashbrowns every hour.

Process Standardization
In process standardization, organizations create uniformity and consistency in how they perform tasks within a process, which is an essential aspect of maintaining the solutions. In other words, organizations establish a set of rules, and these rules direct the employees to complete tasks systematically.
Process standardization includes establishing standardized procedures and guidelines that define how each task should be carried out. By standardizing processes, organizations aim to improve efficiency, reduce errors, and facilitate more accessible training and scalability.
The main advantage of standardization is that everyone involved in the process follows the same steps to achieve consistent results. This consistency remains regardless of individual differences or variations in execution.
Example: The restaurant implements process standardization for making hashbrowns. The idea is that every batch of hashbrowns served at the restaurant will have the same texture, flavor, and appearance, regardless of who prepares them.
- Start by peeling and grating four large potatoes for each batch of hashbrowns.
- Heat a large skillet or griddle over medium heat and add two tablespoons of vegetable oil.
- Spread the grated potatoes evenly on the skillet, forming a thin layer.
- Season the potatoes with salt, pepper, and any other desired spices.
- Cook the hashbrowns for 5 minutes on each side or until golden brown and crispy.
- Use a spatula to flip the hashbrowns and ensure even cooking.
- Once cooked, transfer the hashbrowns to a plate lined with paper towels to drain excess oil.
- Serve the hashbrowns hot alongside breakfast.
Control Chart
A control chart is one of the primary techniques of statistical process control (SPC). It is a graphical display of quality characteristics measured or computed from a sample, plotted against the sample number or time.

Variable (Continuous) Control Charts
Measure the output on a continuous scale. It is possible to measure the quality characteristics of a product.
- X bar – R Charts (when data is readily available) The X bar R chart monitors the performance of continuous data processes by collecting data in subgroups at regular intervals.
- Run Charts (limited single-point data) A run chart displays observed data as they evolve over time. Just a basic graph that displays data values in a time order.
- X – MR Charts (I – MR, individual moving range) An Individual Moving Range (I-MR) chart is used when collecting continuous data in subgroups is not feasible.
- X bar – S Charts (when sigma is readily available) When the subgroups have large sample sizes, X Bar S charts use the S chart to better understand the spread of subgroup data than the range.
- EWMA Chart: The EWMA – The purpose of the Exponentially Weighted Moving Average chart is to monitor variables (or attributes that act like variables) that use the entire history of a given output.
Attribute(Discrete) Control Charts:
The output is a decision or counting. It is not possible to measure the quality characteristics of a product. In other words, it is based on visual inspection, such as good or bad, fail or pass, accept or reject.
- p Charts: (for defectives – sample size varies) – Use P chart when the data are the fraction defective of some set of the process output.
- np Charts (for defectives – sample size fixed) – Use an np-chart when the data is collected in subgroups that are the same size.
- c Charts (for defects – sample size fixed) – Use c charts when the data are concerned with the number of defects in a product—the number of defects collected for the area of opportunity in each subgroup.
- u Charts (for defects – sample size varies) – A u chart is an attribute control chart that displays how the frequency of defects or nonconformities changes over time for a process or system.
Collect data and establish control limits.
Gather data from the process and calculate control limits based on historical data or established specifications. Control limits typically include upper and lower control limits (UCL and LCL), representing the range within which the process should operate under normal conditions.
Plot the data on the control chart.
Plot the collected data points on the control chart over time, with the x-axis representing time (e.g., time periods, batches, or samples) and the y-axis representing the measured values or proportions.
Analyze the control chart.
The primary purpose of a control chart is to improve the process. It provides a “voice of the process” that helps teams to identify special causes of variation in the process. Removing the special cause from the process makes the process more stable and consistent.
Out-of-control: A process is “out-of-control,” meaning special causes exist in either the average chart, range chart, or both. Teams must identify and eliminate special causes to achieve a stable process. The process is out of control if any point in the control chart is out of control limits. The process can also be considered out of control if it exhibits abnormal patterns of variability.
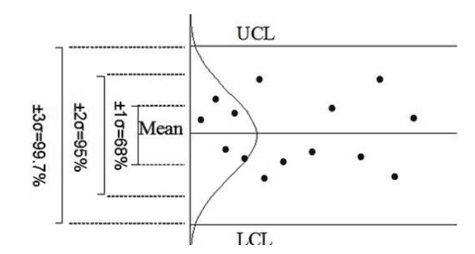
Control limits are three standard deviations above and below the mean. If the process is in control, 99.73% of the averages will fall within these limits. The same is true for the range control limits. Every control chart has two components – the average and the range.
Maintaining Solutions
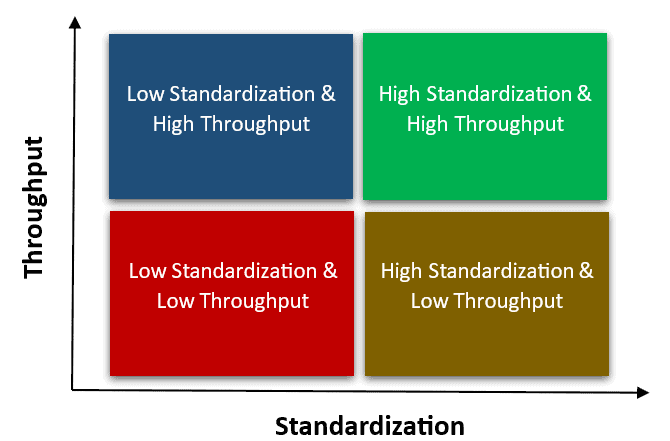
The throughput standardization matrix is a tool that organizations use while maintaining solutions to assess and manage processes based on two key dimensions: process throughput and process standardization. Throughput refers to the rate at which a process can produce output. Standardization defines consistency and uniformity in performing tasks within the process.
- Low Standardization & Low Throughput: It is very challenging to control if the process has low standardization and low throughput. In this case, control measures may involve a combination of standardization efforts to improve consistency and throughput enhancements to address bottlenecks.
- High Standardization & Low Throughput: If the process is highly standardized but has low throughput, it may indicate bottlenecks despite clear guidelines. In this case, control measures may focus on identifying the root causes of low throughput and implementing process automation to improve standardization and efficiency.
- Low Standardization & High Throughput: If the process has low standardization but high throughput, it may indicate that demand is being met despite a lack of clear guidelines. Control measures in this case may involve standardizing procedures (such as work instructions and training) and establishing quality assurance processes to ensure consistency and reduce variability in outcomes.
- High Standardization & High Throughput: If the process has high standardization and high throughput, it is typically well-established and efficient. In this case, maintaining control may involve regular monitoring to ensure that the team follows standards and keeps throughput high.
Organizations can adjust how they control those processes by looking at where processes fall on the throughput standardization matrix. They can use different methods to fix problems and make improvements that fit each process’s needs. This helps make things work better, with higher quality and performance.
Update and maintain the control chart.
Once implemented, continuously collect data and update the control chart to monitor process performance over time. Regularly review the chart to detect any new patterns or trends. Take timely action as needed to maintain process control and quality.
Advantages of throughput
- High throughput leads to fast order fulfillment, thus improving customer satisfaction.
- Improves profitability by reducing production costs per unit.
- Less lead time boosts productivity and resource utilization.
- High productivity with the same resources, such as machinery, equipment, and labor.
- Processes can adjust quickly to changing demand or market conditions.
- Rapid response to market demands and opportunities gives a competitive edge.
Advantages of process standardization
- Standardized processes ensure high quality by providing consistent task performance.
- It helps to streamline workflows, thus reducing time and resources.
- Consistent processes result in fewer errors and defects.
- Standardized processes are more accessible to replicate and scale across different teams.
- It makes it easier to onboard and train new employees.
- Consistent processes help ensure statutory and regulatory compliance.
- It helps to baseline processes and identify areas for improvement and process optimization.
Maintaining Solutions Example
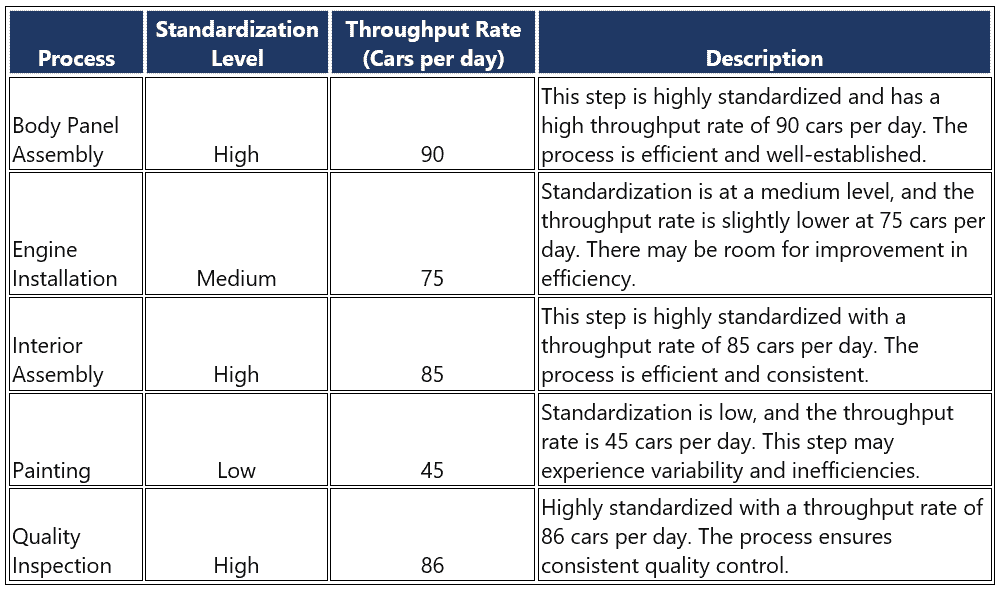
Create a throughput standardization matrix for a car manufacturer to identify bottlenecks, control processes, standardize operations efficiently, and enhance throughput.
Throughput Level:
- High Throughput: The assembly line can produce 90 sedans per day.
- Low Throughput: The assembly line can produce 50 sedans per day.
Standardization Level:
- High Standardization: Each step of the assembly process follows standardized procedures. Workers use specific tools and follow strict quality control measures.
- Low Standardization: Workers have flexibility in how they complete tasks. The lack of clearly defined procedures leads to variability in the assembly process.
Organizations can tailor their process control strategies accordingly by using this matrix. They can identify areas where they could improve standardization and throughput.
