

Control chart rules are the tests that tell you when a point, or a pattern of points, is unlikely enough to come from common-cause variation that you should go looking for a special cause. One point beyond the control limits is the rule everyone knows. The others look for runs, trends and clusters that stay inside the limits but still signal that the process has changed.
The trouble is that different books, software packages and even different pages on the same site quote different numbers: seven points in a row, eight, nine. This page sets out the two classic rule sets, the Western Electric rules and the Nelson rules, explains where the numbers differ and why, and states one rule set to use. It also covers the part most articles skip: every rule you add makes the chart more sensitive and also raises the false alarm rate.
The Short Answer: Five Core Control Chart Rules
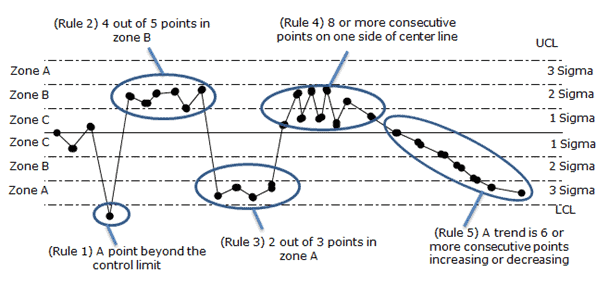
If you want one set to remember, use these five. They are the four Western Electric zone rules plus the six-point trend rule from Lloyd Nelson’s list, and they are the rules shown in our control charts study guide.
| Rule | Signal | Usually means |
|---|---|---|
| 1 | One point beyond a control limit (more than 3 sigma from the center line) | A large, sudden change or a one-off event |
| 2 | 4 out of 5 consecutive points beyond 1 sigma, on the same side | A smaller shift in the mean |
| 3 | 2 out of 3 consecutive points beyond 2 sigma, on the same side | A medium shift in the mean |
| 4 | 8 consecutive points on the same side of the center line | A sustained small shift |
| 5 | 6 consecutive points steadily increasing or decreasing | A drift: tool wear, heating, fatigue |
For an exam, read the numbers in the question. If a question says “seven points in a row”, it is using a different rule set, and the question’s numbers win. The sections below explain where those other numbers come from.
Control Chart Zones A, B and C
Most run rules are written in terms of zones. Divide each half of the chart, between the center line and a control limit, into three bands one standard deviation wide:
- Zone C: within 1 sigma of the center line. About 68% of points fall here when the process is stable.
- Zone B: between 1 and 2 sigma. About 27% of points.
- Zone A: between 2 and 3 sigma. About 4% of points.
- Beyond the limits: more than 3 sigma away. About 0.27% of points, roughly 1 in 370.
Those percentages assume the plotted values are close to normally distributed and independent of each other. That is a reasonable assumption for subgroup averages on an X-bar chart, less so for individual values or ranges. Here, “sigma” means the standard deviation of whatever is plotted. On an X-bar chart that is the standard error of the subgroup mean, not the standard deviation of individual parts.
The Western Electric Rules
The Western Electric Company published its Statistical Quality Control Handbook in 1956 to teach shop-floor people how to read Shewhart charts. Its four zone tests became the first widely used set of control chart rules. Each test looks at one half of the chart at a time.
| Western Electric rule | Test (one side of the center line) |
|---|---|
| 1 | Any single point beyond 3 sigma (zone A or beyond) |
| 2 | 2 out of 3 consecutive points beyond 2 sigma (in zone A or beyond) |
| 3 | 4 out of 5 consecutive points beyond 1 sigma (in zone B or beyond) |
| 4 | 8 consecutive points on the same side of the center line (zone C or beyond) |
The handbook also describes other unnatural patterns, such as trends, cycles, stratification and mixtures, but it treats those as patterns to recognize rather than as fixed counting rules.
Our five core rules use the same four tests in a different order, to match our study guide chart. Core rule 2 is Western Electric rule 3 (4 out of 5 beyond 1 sigma). Core rule 3 is Western Electric rule 2 (2 out of 3 beyond 2 sigma). On an exam, go by the pattern, not the number.
The Nelson Rules
In 1984 Lloyd S. Nelson published eight “tests for special causes” in the Journal of Quality Technology. They include the Western Electric zone tests, change the run length, and add tests for trends, oscillation and the patterns that bad subgrouping produces. Minitab and several other packages number their tests the same way, so these are the rules most learners meet in software.
| Nelson test | Pattern | What it points to |
|---|---|---|
| 1 | 1 point beyond 3 sigma | A large shift, a one-off event or a recording error |
| 2 | 9 points in a row on the same side of the center line | A sustained shift in the mean |
| 3 | 6 points in a row steadily increasing or decreasing | A drift |
| 4 | 14 points in a row alternating up and down | Two sources used alternately (two machines, two operators, two suppliers) or over-adjustment |
| 5 | 2 out of 3 points beyond 2 sigma, same side | A medium shift |
| 6 | 4 out of 5 points beyond 1 sigma, same side | A small shift |
| 7 | 15 points in a row within 1 sigma, either side | Stratification: subgroups that mix sources, so the limits are too wide |
| 8 | 8 points in a row beyond 1 sigma, either side, none within 1 sigma | A mixture of two processes, with points avoiding the middle |
Nelson also gave advice on how to use them. Apply tests 1 to 4 routinely. Add tests 5 and 6 when the cost of a late signal justifies a few more false alarms. Treat tests 7 and 8 as diagnostics for how the subgroups were formed, which is the subject of rational subgrouping.
Why the Numbers Differ: Seven, Eight or Nine Points?
The run rule is where sources disagree most. Western Electric uses 8 points on one side. Nelson uses 9, and he chose it deliberately: a run of 9 has a false alarm probability close to that of a single point beyond 3 sigma, so every test carries about the same weight. Older texts such as Grant and Leavenworth used 7, and many company procedures and some SPC software still do.
The arithmetic shows why the choice matters. If points are independent and the process is centered, each point has a 50% chance of falling above the center line. The chance that a given run of points all fall on one particular side is 0.5 raised to that many points. Counting either side doubles it:
| Run on one side | Probability for a stable, centered process |
|---|---|
| 7 points | 2 × 0.57 = 1 in 64 |
| 8 points | 2 × 0.58 = 1 in 128 |
| 9 points | 2 × 0.59 = 1 in 256 |
| One point beyond 3 sigma (for comparison) | 0.0027, about 1 in 370 |
None of these numbers is wrong. They are different points on the same trade-off between catching small shifts early and crying wolf. What is wrong is mixing them, which is why this site uses one stated set.
Run charts are a separate case. A run chart has no control limits, so its rules count points around the median instead of the mean and use different thresholds. One widely used set in healthcare improvement (Perla, Provost and Murray, 2011) calls 6 or more points on one side of the median a shift and 5 or more points steadily up or down a trend. Don’t carry run chart numbers onto a control chart, or the reverse.
The False Alarm Trade-Off of Adding Control Chart Rules
Every rule is a small hypothesis test, and every test has a Type I error rate. Run several tests on every point and the chance that at least one fires by accident adds up. This is the same alpha and beta trade-off covered in errors in hypothesis testing, applied to a chart.
The standard way to measure it is the average run length (ARL): how many points you plot, on average, before the chart signals. When the process is stable you want a long ARL (few false alarms). After a real shift you want a short one (fast detection).
| Rules applied | Average points to a false alarm (stable process) | Average points to detect a 1-sigma shift in the mean |
|---|---|---|
| Rule 1 only (point beyond 3 sigma) | 370 | 44 |
| Nelson tests 1 to 4 | about 120 | about 17 |
| Western Electric rules 1 to 4 | about 92 | about 9 |
| Five core rules (this site) | about 77 | about 9 |
| All eight Nelson tests | about 73 | about 10 |
Read the table from left to right. Adding zone rules cuts the time to catch a 1-sigma shift from about 44 points to about 9, which is a big gain. The price is a false alarm roughly every 77 to 92 points instead of every 370, about four times as many. Piling on further rules after that buys almost no extra sensitivity for this kind of shift, but it keeps adding false alarms.
Scale it to a plant. Run 50 charts and plot one point on each per day, and the five core rules will produce a false alarm somewhere roughly every day and a half. That’s manageable if the reaction plan is “look, log, and only adjust when you find a cause”. It’s a disaster if every signal triggers a process adjustment, because adjusting a stable process adds variation. The quincunx shows why.
Sports fans know the trap from the other side. In 1985 Gilovich, Vallone and Tversky argued that basketball’s “hot hand” streaks were mostly what chance produces anyway. Later work by Miller and Sanjurjo (2018) found a subtle bias in that analysis, and the debate about how real the hot hand is continues. The lesson for control charts holds either way: random data produce streaks more often than intuition expects. Run rules exist to put a number on “unusual” so that people stop reacting to streaks that chance alone explains.
Which Rules to Use, and When
- Setting up limits (Phase I). When you first calculate limits from historical data, use rule 1 and the run rules to find and remove the subgroups with assignable causes. Then recalculate.
- Routine monitoring (Phase II) on X-bar and individuals charts. Use the five core rules. They catch shifts of about 1 sigma or more within roughly ten points.
- Range, S and attribute charts. These plot statistics with skewed distributions, so the zone percentages above don’t hold and zone rules give more false alarms on one side than the other. Lean on rule 1 and the run and trend rules, and check what your software does by default.
- Small, slow drifts matter more than false alarms. If you need to catch shifts smaller than 1 sigma, adding more rules is a poor tool. Use a CUSUM chart or an EWMA chart instead.
- Autocorrelated data. Chemical processes, temperatures and anything measured very frequently often have points that depend on the previous point. Run rules assume independence and will fire constantly. Fix the sampling interval or model the autocorrelation first.
Whatever you choose, write it into the SPC procedure and the reaction plan, so that everyone reading the chart applies the same rules.
Apply the Control Chart Rules by Hand: a 12-Point Exercise
Here are twelve consecutive subgroup averages, expressed as the number of sigma units above (positive) or below (negative) the center line. Decide which of the five core rules fire, and at which point, before reading the answer.
| Point | 1 | 2 | 3 | 4 | 5 | 6 | 7 | 8 | 9 | 10 | 11 | 12 |
|---|---|---|---|---|---|---|---|---|---|---|---|---|
| Sigma units | +0.3 | -0.8 | +1.2 | +1.5 | +1.1 | +1.8 | +0.9 | +2.4 | +2.2 | +0.5 | -0.2 | +3.3 |
| Zone | C | C | B | B | B | B | C | A | A | C | C | beyond |
Answer. Rule 2 fires at point 6: of points 2 to 6, four (1.2, 1.5, 1.1, 1.8) are beyond 1 sigma on the high side. The process has probably shifted up a little, and it did so around point 3. Rule 3 fires at point 9: two of the last three points (2.4 and 2.2) are beyond 2 sigma on the high side. Rule 4 fires at point 10: points 3 to 10 are eight in a row above the center line. Rule 1 fires at point 12: 3.3 is beyond the upper control limit. Rule 5 never fires; there is no run of six steadily increasing or decreasing values. Notice the order. The zone rules caught the shift at point 6, six points before the first point went outside the limits. That is the case for using them.
Example: Control Chart Rules on an Injection Molding Line
A molder charts the weight of a part on an X-bar and R chart, five consecutive shots every hour. Here is how a month of signals might read, and what each one sent the team to check.
- Two of three hourly averages beyond 2 sigma, above the center line (rule 3). The timing matched a new lot of resin. The lot’s melt flow was at the high end of its specification. The team logged it and asked the supplier for tighter lot-to-lot control.
- Six averages in a row, each heavier than the last (rule 5). A drifting thermocouple was letting the barrel run a little hotter each hour. Maintenance replaced it before any part went out of specification. That is the payoff of run rules: the problem was caught while every point was still inside the limits.
- Fourteen averages alternating high and low (Nelson test 4). The cause wasn’t the process at all. Two technicians were taking the hourly sample, one from cavity 1 and one from cavity 2. The fix was a sampling instruction: always the same cavity, or a separate chart per cavity.
- Fifteen averages in a row, all within 1 sigma (Nelson test 7). After a well-meant change, each subgroup contained one shot from each of the mold’s four cavities. Cavity-to-cavity differences inflated the ranges and widened the limits, so the chart looked calm and could no longer detect anything. See rational subgrouping for the fix.
Notice that two of the four signals were caused by how the data were collected, not by the process. That is common in real work. When a rule fires, check the measurement and the sampling before you touch the machine.
What to Do When a Control Chart Rule Fires
- Mark the point and note which rule fired. The rule hints at the kind of cause: a sudden event (rule 1), a shift (rules 2 to 4), a drift (rule 5) or a sampling problem (Nelson tests 4, 7 and 8).
- Check the data first: a typo, a wrong gage, a different sampler, a changed sampling method.
- Look for what changed at that time: material lot, shift, setup, maintenance, environment. A run rule fires at the end of the run, so the cause usually started at its beginning.
- Act on the cause, not the point. If you find a cause, fix it and record it. If you don’t, log the signal and keep watching. Don’t adjust the process just to move the next point.
- Recalculate limits only when the process has really changed, for example after a confirmed improvement, never just to make signals go away.
Control Chart Rules FAQ
What are the 8 control chart rules?
Usually this means Nelson’s eight tests: 1 point beyond 3 sigma; 9 in a row on one side; 6 in a row increasing or decreasing; 14 alternating up and down; 2 of 3 beyond 2 sigma; 4 of 5 beyond 1 sigma; 15 in a row within 1 sigma; 8 in a row beyond 1 sigma on either side. Some study materials list eight rules with slightly different counts, so check the source.
What is the difference between the Western Electric and Nelson rules?
Western Electric (1956) has four zone rules with an 8-point run. Nelson (1984) keeps the zone tests, lengthens the run to 9 points, and adds tests for trends, alternation, stratification and mixtures, for eight in total.
What is the rule of seven?
A simplified run rule: seven consecutive points on one side of the center line, or seven in a row trending up or down, signal a non-random pattern. It appears in older quality texts and in project management study materials. A stable, centered process produces a 7-point run on one side about once in 64 tries, which is why stricter rule sets use 8 or 9.
Does one point outside the limits always mean the process is out of control?
It means there is strong evidence of a special cause, strong enough to investigate. About 1 point in 370 from a stable process will fall outside 3-sigma limits by chance, so a single point with no cause found is possible. Two in a short time is much stronger evidence.
Should I turn on every rule in my SPC software?
Usually not. Each extra rule adds false alarms, and the table above shows most of the sensitivity comes from the first few. Turn on the rules your reaction plan can actually handle, and use the subgrouping tests (Nelson 7 and 8) when you are checking how a chart was set up.
Are control chart rules on the Six Sigma exam?
Yes. ASQ’s Black Belt body of knowledge asks you to “interpret control charts and distinguish between common and special causes using rules for determining statistical control” (VIII.A.5). The Green Belt body of knowledge covers distinguishing common and special causes from control chart analysis (VI.A.1), and ILSSI’s Green Belt list includes tests for special cause variation. Expect a sketch or a list of points and a question about which rule, if any, is broken. If you want exam-style practice on reading charts, Pass Your Six Sigma Green Belt includes control chart questions with full walkthroughs.
Related Pages
- Control charts and the control charts study guide
- X-bar R control charts and I-MR charts
- Rational subgrouping
- Run charts and statistical process control (SPC)
When you’re ready, there are a few ways I can help:
First, join 12,000+ other Six Sigma professionals by subscribing to my email newsletter. A short read every Monday to start your work week off correctly. Always free.
* * *
If you’re looking to pass your Six Sigma Green Belt or Black Belt exams, I’d recommend starting with my affordable study guide:
1)→ 🟢Pass Your Six Sigma Green Belt: a study guide organized by the exam Body of Knowledge, 1,000+ practice questions with detailed answer explanations, and 15+ full-length mock exams
2)→ ⚫Pass Your Six Sigma Black Belt: the full Black Belt Body of Knowledge, 2,000+ practice questions with detailed answer explanations, and 15+ full-length mock exams
You’ve spent so much effort learning Lean Six Sigma. Why leave passing your certification exam up to chance? This comprehensive study guide offers 1,000+ exam-like questions for Green Belts (2,000+ for Black Belts) with full answer walkthroughs, access to instructors, detailed study material, and more.
Thousands have used this system to prepare. Join them here.