Rational sub-grouping is the process of organizing the data into groups that were produced basically under the same conditions. In other words, it is a process to organize the data into groups that were produced under similar conditions to measure the variation between subgroups instead of each data point.
Rational subgroups help in the estimation process of short-term variations. Thus, rational subgrouping is the basis for operating control charts in a successful manner. These variations later help us predict the long-term variations and their control limits, depending on the type of causes for the variation (special or common).
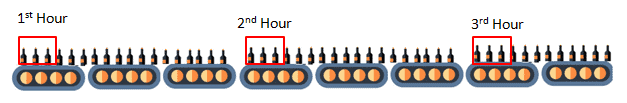
Rational subgroups indicate the common cause variation in the process and also the data collection method. For example, a plastic molding machine produces 200 bottles per hour. The supervisor randomly selects three bottles every hour and measures the weight in grams. The three bottles are one subgroup.
Types of variations
Within subgroup variation: Variation existed within subgroups, also known as inherent variation.
Between subgroup variation: Variation between the subgroups due to special causes in the process.
The control chart is a graph to study the process changes over time. A control chart always has a central line for the average, an upper line for the upper control limit, and a lower line for the lower control limit. The control limits are ±3σ from the centerline. The control limits are computed using the variation of subgroups. Thus, it is important to select subgroups that have only inherent variation. The most effective way to improve process quality is by finding a way to achieve minimum variation within and between the subgroups.
Rational subgroup best practices
- The subgroups are all formed from the observations that have been taken in a sequence (time-ordered).
- Select the subgroups to make each subgroup as homogeneous as possible. This provides the maximum opportunity for estimating expected variation from one subgroup to another.
- The observations within the subgroups are independent, which means no observation influences, or results from, another.
- The observations within a subgroup come from a lone steady process. Otherwise, the special causes that occur at high frequency within the subgroup result in high variation between the subgroups.
When do we need Rational Subgroups?
- Special cause variation in the process may divulge the need for rational subgrouping.
- Non-normal data can sometimes also indicate sub-groups exist.
Steps to Develop Rational Subgroups
- Identify the right data (Quality characteristics that are important to customers) to capture or track.
- Select the source of data and the categories like shift, material, machine, etc.
- Produce elements of the subgroup in closely similar identical ways and determine the range of variation within the subgroup.
- Select the best sample data for subgrouping to get the desired control chart.
- Use the ANOVA test to confirm the statistical difference between sub-groups.
Example of Rational Subgroup
Example: There are four bottle-filling machines in XYZ Inc. The amount of material filling each bottle is one of the critical quality characteristics that we are looking to monitor. Below are the different methods of subgrouping the data for the control chart.
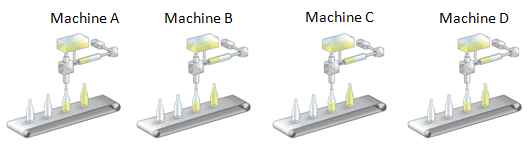
Step 1: The first subgroup consists of four bottles from machine 1. The second subgroup consists of four bottles from machine 2, and the third subgroup consists of four bottles from machine 3. Finally, the fourth subgroup consists of four bottles from machine 4.
Step 2: Form a subgroup consisting of one bottle each from four machines.
Step 3: Select each subgroup to have a mix of four bottles from the machines.
Compute the Range chart, standard deviation, and average chart for all the above three scenarios and determine the best subgrouping method.
Rational subgroups of individual control charts
Often rational subgrouping is a little bit unclear when dealing with individual control charts. In other words, when the subgroup size is one. The basic idea underlying control charts of all types is to identify the capability of the process. The mechanism by which this is accomplished is the careful formation of rational subgroups.
Additional Rational Sub Grouping Resources
- https://qualityamerica.com/LSS-Knowledge-Center/statisticalprocesscontrol/rational_subgroups.php
- https://www.moresteam.com/university/workbook/wb_subgroupintro.pdf

Comments (10)
Hello,
There is a question I’m not sure how to answer. Can you help?
Which of the following definitions are NOT associated with a rational subgroup?
A. Homogeneous
B. Essentially alike
C. Product produced approximately at the same time
D. One part is produced every hour
I was thinking that D is the answer, but wanted to hear thoughts.
I agree that D makes the most sense, Jennifer. We’re looking for items created within a “snapshot” of the process over a very small amount of time. And D would NOT fit that description.
Thank you Ted!
it is under the SPC?
Dear Sir,
We deals in equipment manufacturing sector, my machine input size is 1250mm x 2500mm, but components punch sizes as well as numbers (i.e., pcs) varies. some time its one single pcs and sometime its 200pcs in single sheet. which chart can i prefer & how sub grouping can be defined. do suggest.
Thank you for your question. With variable component counts per sheet (from 1 to 200 pcs), selecting the right control chart and defining rational subgroups is key.
Chart Selection:
Subgrouping Tips:
For a deeper dive, explore our courses:
Green Belt |
Black Belt
So many grammar mistakes has me scared to get too far into this. I assume you mean to say the subgroup size is 3 here (not 4):
or example, a plastic molding machine produces 200 bottles per hour. Supervisor randomly selects 3 bottles every hour and measures the weight in grams. The four bottles are one subgroup.
Pretty sure the headline below that should read “types of variation”, not “types of subgroups”.
And then ya got these that arent even complete sentences: In statistics, control charts plotting for mean and range for each subgroup. Then statistics compared to the control limits.
… What is going on here??
Hi Ross,
Many of these pages originated as bulleted list notes. We’ve been in the process of expanding these over time. Sometimes updates are scheduled and haven’t happened yet. Other times, updates are in-progress.
Nonetheless, I appreciate you pointing out the issues. We prioritized addressing them because you’re a member. This should read more fluidly now.
Best, Ted.
Generally content is well explained, but I have to agree with the grammar, spelling and related errors, they make some concepts really difficult to understand. This article remains a mouthful even after the above correction, I still struggle with many sentences. Many of them aren’t even sentences and the best effort to reorder words or fill in blanks may or may not divulge a meaning, let alone certainty of getting the correct meaning. A few examples:
mixed up words / extra words / missing words..?
The control limits are computed using within the variation of subgroups.
not an actual sentence
The effective way to improve the process quality by maintaining the minimum variation within the subgroups and also between the subgroups.
Otherwise, the special causes that occur at high frequency within the subgroup which results in high variation between the subgroups.
If the material quantity is one of the critical quality characteristics.
I see your point. I’ve taken another look through and made multiple updates, edits, and corrections.