Stuck trying to picture how Six Sigma magic works in your world? Project case studies often feel distant, industry-specific, and…well, frankly, a bit dry. I hear you!
But what if you could experience the DMAIC journey through a lens as familiar as your favorite online shopping cart?
This week, I am walking through a fictional Six Sigma project that transformed an everyday e-commerce store. No jargon, no complex industry specifics, just pure problem-solving power in action.
Get ready to:
- Unravel the mystery: Walk step-by-step through the Define, Measure, Analyze, Improve, and Control phases.
- Imagine yourself as the Six Sigma hero: Put yourself in the shoes of the problem-solver and ask, “What would I do?”
- Witness the results: See firsthand how data-driven decisions led to tangible improvements for the business.
Intrigued? This is just the tip of the iceberg. Dive into the entire case study and discover how Six Sigma principles can blossom in any industry, including yours.
Bonus: Let us know if you’d like more industry-agnostic case studies! We’re always happy to fuel your Six Sigma journey.
E-Commerce Store DMAIC Case Study
The fictitious E-commerce store, TechGadgetsPlus, is struggling with shopping cart abandonment. We’ve all experienced cart abandonment. It’s when you go through checkout for something you want but don’t complete the purchase for some reason.
As you can imagine, reducing cart abandonment would be a critical revenue issue!
In this case study, I’ll illustrate several tools in each phase for brevity’s sake and list others you would likely use.
Define Phase
The goal of the Define phase is to clearly articulate the project’s problem, objectives, and scope. It involves identifying the process to be improved, understanding customer requirements, and setting clear project goals. The aim is to establish a precise problem statement that guides the entire project.
Problem Statement: (Note how this is written in S.M.A.R.T format) Reduce the cart abandonment rate from 65% to 45% over the next six months, thereby increasing the conversion rate and potentially adding an estimated $500,000 in monthly revenue. The cost of inaction includes the lost revenue of approximately $3 million over the next six months and a potential decrease in customer satisfaction and loyalty, which can further impact future revenues.

Define Phase Tools and Techniques:
Project Charter: To outline the project’s scope, objectives, and stakeholders.
Voice of the Customer (VOC): You could gather quantitative and qualitative feedback here. Qualitative by working with people to collect insights from customer feedback on why they abandon carts via a survey or a user experience study. Quantitatively, there are tools on the market that could help you analyze user behavior for a sample of your audience on the web page.
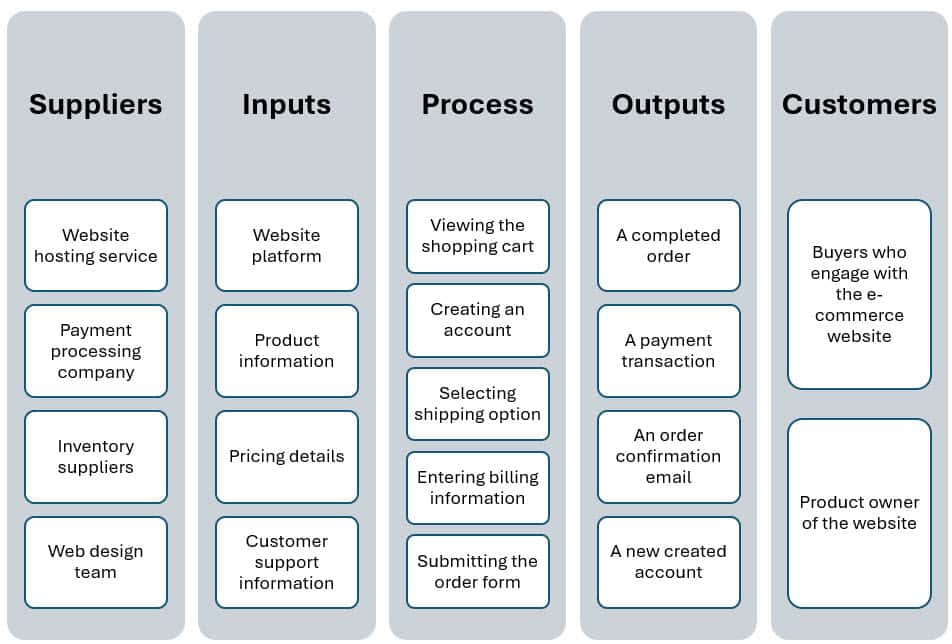
SIPOC Diagram (Suppliers, Inputs, Process, Outputs, Customers): To map out the e-commerce process from website visit to checkout.
- Suppliers: Entities that provide the necessary resources for the e-commerce process. This could include the website hosting service, payment processing companies, and inventory suppliers.
- Inputs: The resources needed to facilitate the e-commerce process. Inputs might be the website platform, product information, pricing details, and customer support information.
- Process: The steps a user goes through from visiting the website to checkout. This could include landing on the website, searching for products, adding products to the cart, and completing the purchase.
- Outputs: The results of the e-commerce process. Outputs could be a completed order, a payment transaction, and an order confirmation email.
- Customers: The end users or buyers who engage with the e-commerce website to make a purchase.
Measure Phase
In the Measure phase, the objective is to quantify the current performance of the process. This involves collecting relevant data on process performance and establishing a baseline to measure future improvements. The goal is to accurately understand the extent of the problem and identify key metrics for improvement.
Objective: Quantify the cart abandonment rate and identify related metrics that influence this rate.
Measure Phase Tools and Techniques:
Data Collection Plan: To define what data will be collected, how, and from which sources (website analytics, customer surveys).
Statistical Analysis Software: To analyze website traffic and cart abandonment trends.
Process Mapping: To identify potential failure points in the checkout process.
Fictitious Data Example: website traffic analysis over the past three months shows an average cart abandonment rate of 65%, with the highest abandonment at the shipping options and payment method selection stages.

Analyze Phase
The Analyze phase aims to identify the root causes of defects or inefficiencies. This step seeks to uncover the underlying factors contributing to the problem by analyzing the data collected in the Measure phase. The goal is to pinpoint specific areas where improvements can be made and identify the root causes of cart abandonment.
Analyze Phase Tools and Techniques:
Fishbone Diagram: To explore all potential causes of cart abandonment, such as website design, shipping costs, account creation requirements, and payment security concerns.
- Main Spine: Represents the problem, which is cart abandonment.
- Major Bones (Categories):
- Website Design: Navigation complexity, mobile incompatibility, lengthy checkout process.
- Shipping Costs: High fees, lack of free shipping options, unexpected costs at checkout.
- Account Creation Requirements: Mandatory registration, complex signup forms.
- Payment Security Concerns: Lack of security badges and unfamiliar payment gateways.
- Payment Options: Limited payment methods, no digital wallet options.
- Customer Service: Lack of support channels and slow response times.
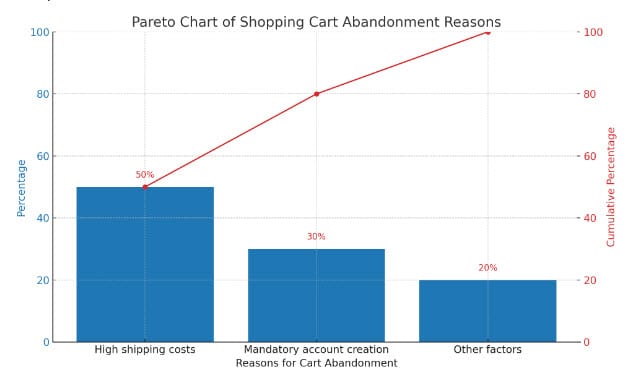
Pareto Analysis: To prioritize abandonment causes based on their frequency and impact.
Hypothesis Testing: Used to validate the identified causes statistically. Some examples might include the following:
1. Comparing abandonment rates:
Chi-square test: Compare abandonment rates across different groups (e.g., device type, marketing channel, product category) to see if there’s a significant association.
We’ll need to construct a contingency table to perform a chi-square test comparing abandonment rates across different groups (e.g., device type, marketing channel, product category). Let’s assume we’re comparing abandonment rates across Mobile and Desktop devices. Here’s a hypothetical dataset:

We’ll perform a chi-square test of independence to determine if there’s a significant association between the device type and the purchase completion outcome. The null hypothesis (H0) is that device type and completion outcome are independent, while the alternative hypothesis (H1) is that there is a significant association between them.
The results of the chi-square test are as follows:
- Chi-square statistic: 9.584
- p-value: 0.00196
- Degrees of freedom: 1
- Expected frequencies:
- For Mobile: [135 completed purchases, 65 abandoned carts]
- For Desktop: [135 completed purchases, 65 abandoned carts]
Given the p-value is less than 0.05, we reject the null hypothesis. This suggests a significant association exists between the device type and whether a purchase is completed or the cart is abandoned. In this case, device type appears to influence cart abandonment rates, with different rates observed for Mobile and Desktop devices.
Given that result, we would likely develop different Improve Phase strategies for piloting different potential solutions for both the mobile and desktop experiences.
T-test or ANOVA: Compare abandonment rates across two or more numerical groups (e.g., cart value, discount offered) to see if there’s a significant difference.
2. Testing interventions:
- A/B testing: Randomly split website visitors into groups experiencing different checkout processes, offers, or website features. Use chi-square tests to compare abandonment rates between groups and assess the intervention’s effectiveness.
- Before-after test: Compare abandonment rates before and after implementing a change to see if it had a significant effect. Use paired t-tests if data are paired (e.g., same users before and after) or appropriate non-parametric tests if not.
3. Identifying key features:
- Logistic regression: Build a model predicting abandonment likelihood based on various website features (e.g., page load time, number of steps in checkout). Analyze coefficients to identify features with significant impact.
- Decision trees and random forests: Explore relationships between features and abandonment without making specific assumptions about the data. Identify feature combinations with high abandonment risk.
Fictitious Data Example: Pareto analysis indicates that 80% of the abandonment issues are due to high shipping costs (50%) and mandatory account creation (30%).
Improve Phase
The Improve phase aims to develop and implement solutions to address the root causes identified in the Analyze phase. This involves generating ideas for improvement, selecting the most effective solutions, and making changes to the process. The goal is to make tangible improvements that reduce defects or inefficiencies. In this example, we are seeking to implement solutions to minimize cart abandonment based on root cause analysis.
Improve Phase Tools and Techniques:
Brainstorming: To generate ideas for reducing shipping costs and making account creation optional or more appealing.
Pilot Testing: To test the impact of these changes on a small scale before full implementation.
Design of Experiments (DOE): To systematically vary and test changes to determine their impact on the abandonment rate.
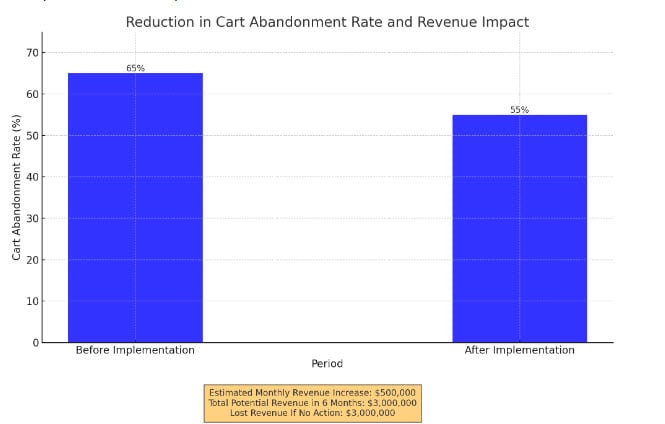
Fictitious Data Example: Implement a free shipping option for orders over a certain amount and introduce a guest checkout option. Pilot testing shows a 10% decrease in cart abandonment rates in two weeks.
The 10% improvement is NOT the original 20% improvement we wanted. However, it would still be a massive win, adding $250,000 to monthly revenues!
We would likely do two things at this point:
1) Secure those wins by implementing controls.
2) Iterate further in the Improve phase to develop additional improvements.
Control Phase
In the Control phase, the objective is to sustain the improvements made. This involves putting systems, processes, or controls in place to maintain the gains over time. The goal is to prevent regression and ensure that the process continues to operate at its new, improved level of performance. In this example, we want to sustain the improvements and ensure the cart abandonment rate does not regress.
Control Phase Tools and Techniques:
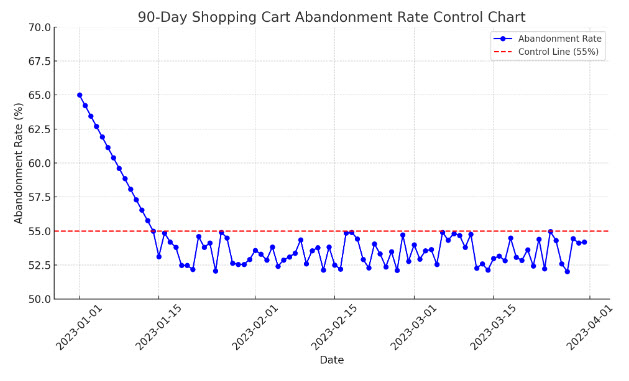
Control Charts: To monitor the cart abandonment rate over time and maintain improvements. The control chart above displays the variable data over 90 days, measuring shopping cart abandonment rates. It starts with an average abandonment rate of 65%, which falls to 55% within the first two weeks. Following this initial drop, the rates consistently remain at or below the 55% threshold, effectively meeting the control objective.
Standard Operating Procedures (SOPs): Update to reflect new checkout processes.
Training: For staff to understand and maintain new processes (like monitoring cart abandonment rates) and customer service practices.
Fictitious Data Example: Control charts monitor weekly cart abandonment rates, with triggers for investigation if rates exceed the 45% target. SOPs and staff training materials are updated to include the new checkout options.

Conclusion
This Six Sigma DMAIC project for TechGadgetsPlus aims to reduce cart abandonment rates significantly and enhance the overall customer shopping experience, thereby increasing revenue and customer loyalty. The e-commerce store can substantially improve its operations and financial performance by applying Six Sigma tools and techniques.
When you’re ready, there are a few ways I can help:
First, join 30,000+ other Six Sigma professionals by subscribing to my email newsletter. A short read every Monday to start your work week off correctly. Always free.
—
If you’re looking to pass your Six Sigma Green Belt or Black Belt exams, I’d recommend starting with my affordable study guide:
1)→ 🟢Pass Your Six Sigma Green Belt
2)→ ⚫Pass Your Six Sigma Black Belt
You’ve spent so much effort learning Lean Six Sigma. Why leave passing your certification exam up to chance? This comprehensive study guide offers 1,000+ exam-like questions for Green Belts (2,000+ for Black Belts) with full answer walkthroughs, access to instructors, detailed study material, and more.
