Basic Six Sigma statistics is the foundation for Six Sigma projects. It allows us to describe the data that makeup processes X and Y in terms of numbers. Today, statistics is an important part of the day-to-day activities of any organization. Numbers and data play a vital role in Six Sigma projects; hence Six Sigma professionals and other stakeholders must have basic Six Sigma statistics knowledge.
Data Types
Data is a set of values that can be either qualitative or quantitative. It may be a number, a measurement, an observation, or even a description.
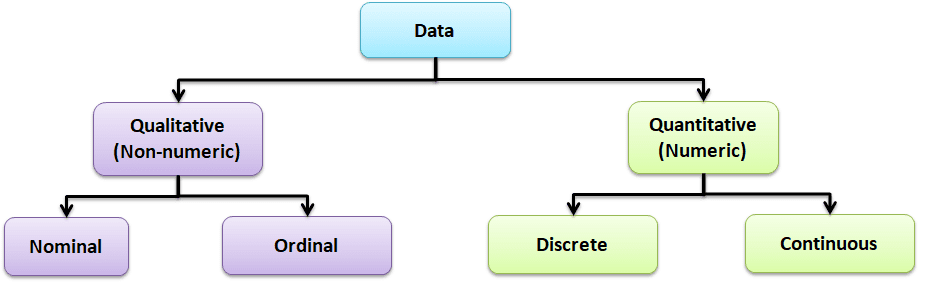
Qualitative data: Qualitative data, also known as non-numeric data, is basically data that describes the traits of a value or data point. It is made of a finite number of possible categories into which each data point may fall.
Types of Qualitative data
- Nominal data: A type of descriptive data with more than two categories; it can refer to the names or labels of the data points. For example, Hair color – black, brown; Gender – male or female.
- Ordinal data: Ordinal data provides good information about the order of choices. In other words, it arranges information in a particular order without indicating a specific relationship between items. Example: pass or fail, customer service, good or bad, etc.
Quantitative data: It is also known as numerical data. The data points are counts or measurements. Unlike Qualitative data, it consists of an infinite number of possible categories into which each data point may fall. The Quantitative data is further divided into two data types:
- Discrete data: The data is discrete if the measurements are whole numbers or counts. For example, the number of customer complaints, weekly defects data, etc.
- Continuous data: The data is continuous if the measurement takes on any value, usually within some range. For example, Stack height, distance, cycle time, etc.
Population Parameters
Population parameters refer to the characteristics of a population. In other words, it describes some aspect of the population. These are used to make inferences about a larger group based on a smaller sample.
Sample Statistics
Sample statistics are measures calculated from a sample of individuals that are used to estimate or make inferences about the population parameters.
Furthermore, sample statistics is to estimate the population parameters, as it is often impossible or impractical to measure the characteristics of an entire population. The accuracy of the estimates obtained from sample statistics depends on the sample size and how the sample was selected from the population. Larger sample sizes generally lead to more accurate estimates of the population parameters.
A few common population parameters and sample statics are:
Mean: The mean is the average value of a variable in a population or sample. It is calculated by adding all data values divided by the number of data points.
Standard Deviation: Standard deviation is the most popular measure of dispersion. It is used to measure the amount of variation in a process. It indicates how much the individual values in a population or sample deviate from the population mean.
Proportion: The proportion is the number of individuals in a population or sample who holds a certain characteristic divided by the total number of individuals in the population or sample. For example, the proportion of male in a population or sample would be the number of males divided by the total population or sample.
Variance: Variance measures the dispersion of a set of data points around their mean value. It is calculated by taking the average of the squared differences of each value from the population or sample mean.
Distinguish between population parameters and sample statistics
- Population parameters are descriptive measures that summarize a characteristic of a whole population. Whereas, Sample statistics, are descriptive measures that summarize a characteristic of a sample from a population.
- Population parameters are fixed and constant, while sample statistics can vary depending on the sample selected from the population.
- Population parameters are typically of greater interest to researchers than sample statistics, as they provide a more accurate description of the population.
- Since it is often impractical to measure characteristics of an entire population, sample statistics are important in helping to make inferences about the population.
Basic Types of Statistics used in Six Sigma
Statistics are made of principles and methodologies for collecting, analyzing, interpreting, and presenting data in a meaningful way. Statistics helps to understand the data behavior, identify improvement opportunities, and predict future process performance.
Types of statistical analysis:
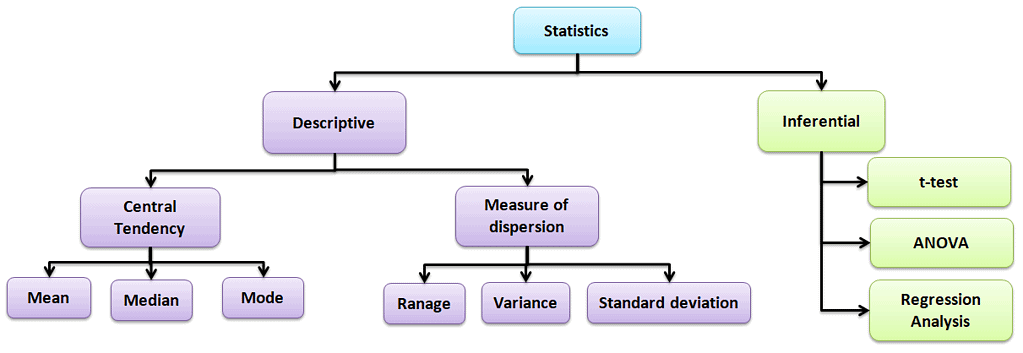
Descriptive statistics
Values that describe the traits of the sample or population. In other words, it provides a simple summary of the sample and the measures.
Central Tendency
Refers to the statistical measure used to determine the center of a distribution of a data set. Based on the situation, the measure of central tendency could be either Mean, Median, or Mode.
- Mean: The mean is the total of all data values divided by the number of data points.
- Median: The median is the middle value when the data is arranged in order from least to greatest or vice versa. If the data set has even values, the median is the average of the middle two values.
- Mode: The mode is the value that often occurs in the data set.
Measure of dispersion
Dispersion is the degree of variation in the data. Dispersion measures the extent to which different items tend to disperse from the central tendency.
Different types of measures of dispersion
Range: Range is the difference between the maximum and the minimum value.
Variance: Variance measures the dispersion of a set of data points around their mean value.
Standard Deviation: Standard deviation is the most popular measure of dispersion. Main purpose is to measure the amount of variation in a process. Standard Deviation is one of the most common measures of variability in a data set or population.
Kurtosis: Kurtosis is a statistical measure to determine whether the data is heavy-tailed or light-tailed relative to a normal distribution. In other words, it is a measure of the thickness of the tails of a distribution.
Inferential statistics:
The purpose of Inferential statistics is to draw conclusions or inferences about the traits of a population based on data from a sample. In other words, using probability to learn about a population parameter from information given in a sample. T-tests, regression analysis, and Analysis of variance (ANOVA) are a few examples of Inferential statistics.
Shape of the distribution
The shape of data distribution is shown by its number of peaks and by the symmetry possession, skewness, or uniformity. Skewness is a measure of the lack of symmetry. In other words, skewness is the measure of how much the probability distribution of a random variable deviates from the Normal Distribution.
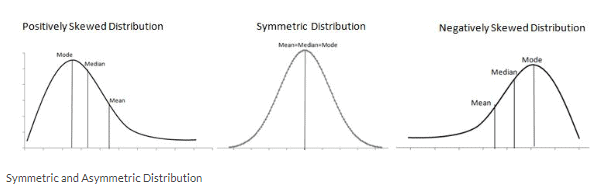
Symmetrical Distribution: Generally, symmetrical distribution appears as a bell curve. The perfect normal distribution is the probability distribution that has zero skewness. Symmetrical distribution occurs when mean, median, and mode occur at the same point, and the values of data points occur at regular frequencies.
Positively Skewed Distribution: A distribution is said to be skewed to the right if it has a long tail that trails toward the right side. The skewness value of a positively skewed distribution is greater than zero.
Negatively Skewed Distribution: A distribution is said to be skewed to the left if it has a long tail that trails toward the left side. The skewness value of a negatively skewed distribution is less than zero.
Summarizing the data
Graphical analysis is one of the best ways to summarize the data in Six Sigma projects. It creates pictures of the data, which will help understand the patterns and the correlation between process parameters. Often, graphical analysis is the starting point for any problem solving method.
Different graphical analysis methods:
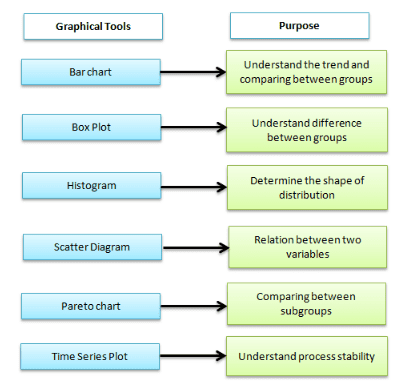
Box-and-Whisker plot, also known as Box and Whisker plot, is a pictorial representation of continuous data. The box plot shows the Max, Min, median, interquartile range Q1, Q3, and outlier.
A run chart is also known as a time series plot. It is a line graph of data plotted over time. It helps to identify the pattern of the data in the time series. Because they don’t use control limits, we cannot judge whether the process is stable or not.
Pareto Chart, also known as 80-20 rule. It is a combination of a bar chart and a line chart. The actual data is in descending order using a bar chart, and the cumulative data is in ascending order using a line graph.
Helpful Basic Six Sigma Statistics Videos
Six Sigma Symbols
s (or sd): The sample standard deviation is a point estimate for the population standard deviation / the dispersion statistic for samples
µ: the central tendency statistic for populations
XBar: a point estimate for the population mean
σ: the actual population standard deviation for the measurement of dispersion in a population
N is for populations
n: The statistic for number of data in a sample
x: the individual value
Basic Six Sigma Statistics References
Statistics Guides:
- The Cartoon Guide to Statistics, by Larry Gonick
- Purchased by Nishimura lab
- OpenIntro Statistics, by David Diez
- PDF available for free
- Second edition purchased by Nishimura Lab
- Statistics and Probability, by Khan Academy
- Website with lessons
- Statistics for Biologists Collection, by Nature Publishing Group
- A series of articles chronicling statistical issues Biologists may face
- Stat Trek
- Website for statistics training and tools
- Think Stats, by Allen B. Downey
- Free PDF
- Includes code examples and exercises in the accompanying Github repository
- A biologist’s guide to statistical thinking and analysis, by David Fay and Ken Gerow
- PDF of WormBook chapter co-authored by fellow Front Range C. elegans researcher David Fay
- Explain XKCD
- A wiki-style database of statistics-related XKCD comics
- Includes explanations of the statistical concept referenced in the comic
- Statquest Youtube Videos:
When you’re ready, there are a few ways I can help:
First, join 30,000+ other Six Sigma professionals by subscribing to my email newsletter. A short read every Monday to start your work week off correctly. Always free.
—
If you’re looking to pass your Six Sigma Green Belt or Black Belt exams, I’d recommend starting with my affordable study guide:
1)→ 🟢Pass Your Six Sigma Green Belt
2)→ ⚫Pass Your Six Sigma Black Belt
You’ve spent so much effort learning Lean Six Sigma. Why leave passing your certification exam up to chance? This comprehensive study guide offers 1,000+ exam-like questions for Green Belts (2,000+ for Black Belts) with full answer walkthroughs, access to instructors, detailed study material, and more.
