A process map is a tool that graphically shows a process’s inputs, actions, and outputs in a clear, step-by-step map of the process. This is generally done in the Define stage of a DMAIC project. The purpose of process mapping is to help team members and others within the process understand the process.
What is Process Mapping?
Process mapping is a graphical representation with descriptions of how things get done. It helps the participants see the details of the process closely and guides them in decision-making. One can identify the significant strengths and weaknesses in the current process, such as the contribution of individual steps. Further, it helps to reduce the cycle times and defects in the process and improves its productivity.
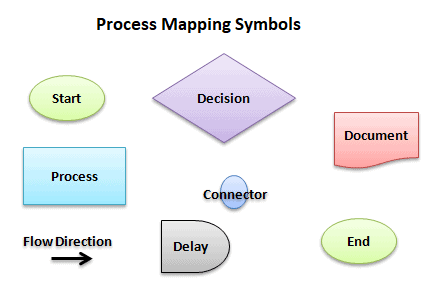
The major components of a process map include the inputs, outputs, and steps in the process. A good process map should illustrate the workflow and the organization’s interaction. It should use a common language (symbols) that everyone quickly understands. An ideal process map should contain proper detail with respect to multiple paths, decisions, and rework loops.
Why Does a Business Need a Process Map?
Process mapping provides a visual glimpse of different business processes. It provides the necessary information, helps determine the Who, What, Where, Why, When, and How aspects of the process and problem, and even guides towards possible solutions. Some of the reasons for the need for a process map are:
Pictures guide better than words.
Using graphs, charts, tables, and images guides better than an extensive, bland report with many data fixation issues.
Process maps facilitate improvements.
Process maps facilitate improvements in the process since it becomes easy to pinpoint the specific areas that need changes, like bottlenecks, delays, capacity constraints, etc., in light of the efficiency and effectiveness of the process.
Faster decisions
Decision-making becomes fast as it deals with the ‘show me’ aspect and not the ‘tell me’ element of the process and the problem areas.
Easier to track improvements
Process maps may ultimately serve as a measurement tool for a process. This is necessary to manage and improve it. Process improvements can easily be tracked using process maps since it becomes possible to audit and understand different areas of the process and the organization.
Process maps lead to better training.
Visual illustration for training would be much more effective than any oral tool. The visual examples register faster in human brains and help them understand things better and quicker.
Guides change management
In the need for change, when the organization moves on making the changes without understanding the current working process, it is likely to commit more mistakes or deploy its resources to create more troubles. Process maps provide a detailed outlook of the current process and guide effective change management.
Types of process maps
There are two significant types of process maps: process flowcharts and deployment flowcharts.
Process Flowchart:
A process flowchart is a simple process map that provides a visual model of the sequence of activities and their points of decision. These flowcharts provide the basic details of the process, which can later be augmented by adding different staff roles.
Process Flowchart Excel Template
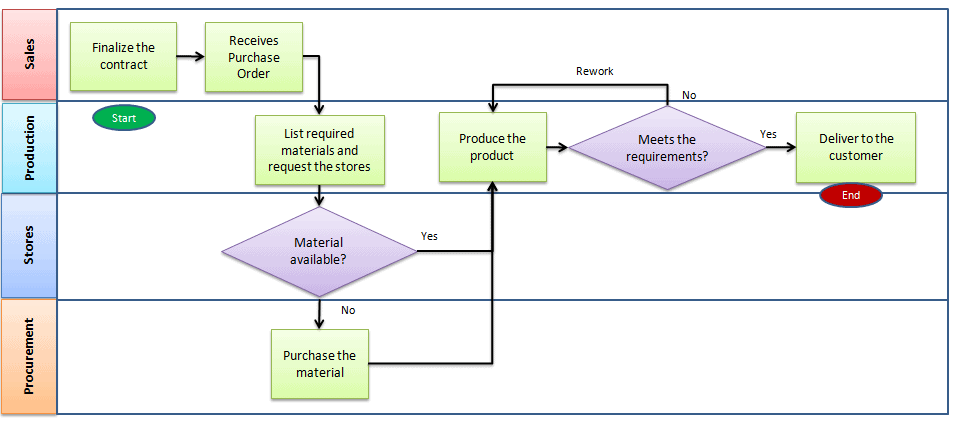
Deployment Flowchart:
These process maps provide the interactions between different departments and the roles performed by different people in the organization. Also termed ‘swim-lane’ charts, these process maps have vertical lines showing the movement of the process from person to person.
Deployment Flowchart Excel Template
Why Bother with a Process Map?
Why bother mapping your process? There are several great reasons.
1) Process Maps Help You Uncover Waste
Mapping your process gives you a visual tool where you can uncover waste. I usually am not a fan of commercials, but check this one out from GE (Remember that GE is a renowned adopter of Six Sigma– they used the Six Sigma methods to improve their business process with excellent results.) Here, they use Process Mapping to double the output speed of a manufacturing facility–a 100% increase.
https://www.youtube.com/watch?v=Yw3CTo81g7g
To paraphrase the ad, it shows who does what, when, and where. Then you can follow up with the question ‘Why’? You can propose a hypothesis and test it. In this case, “Could you reduce five steps to 2?” (Note: The 5 whys are also helpful in this step.)
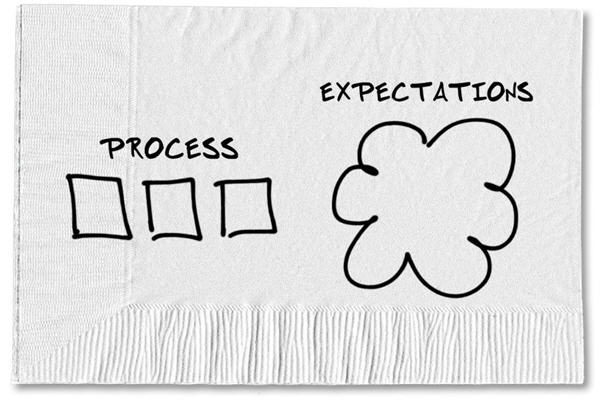
2) Process Maps Help You Deliver to Expectations
Because there is a process, and then there are expectations.
How to Start Process Mapping
Before beginning the process mapping, you must have clearly established boundaries to ensure you can manage the scope of the flowchart you create. The boundaries must be determined first so the team knows what tasks, activities, and decisions should be added to the flowchart.
Steps to Follow
Business managers can develop a practical process map that facilitates continuous improvement in the business process by following some simple steps. The steps for creating a process map can be found below:
Step 1: Select the process
Firstly, the managers must identify the reason for creating the process map. Is it that the process is not performing up to its mark? Or does the firm wish to plan a new service? Or is the goal to augment the value derived from the process?
Secondly, you should identify the beginning of the process. In other words, you need to find the events that create the demand for the process map and the trigger behind the process.
Thirdly, you must define the end goal, which consists of the parameters or conditions that will finally satisfy the demand.
Lastly, the business managers must develop a document containing information about the specific process, business problem, shareholders’ expectations, business objectives, and process scope.
Step 2: Identify the Scope of the Process Steps
The business managers must observe the entire process and collect data and information. You must be sure to document the observed process properly and collect data. It is also essential to identify all the parameters involved in the process, like the machinery, suppliers, etc. Identifying and verifying the inputs and outputs involved in the process is vital. This can be done through effective brainstorming, industry standards, work instructions, and the experience of the operators and managers.
Step 3: Plan and Schedule Resources
Identify the systems involved in the process. While designing the process map, the managers’ mindset must shift from functional to process-oriented. This can be done by focusing on the roles rather than the jobs. Based on the systems and roles, proper scheduling of the people involved, tasks involved, and estimated time needs to be done.
Step 4: Select Mapping Techniques
The next step is selecting the mapping technique, like a process or deployment flowchart. Next would be to plan the process of interviews with individuals and focused groups. It is also advised to review any previously documented process map to understand previous mapping efforts, organizational charts, and job descriptions.
Step 5: Conducting Interviews
Now, it is time to conduct the interviews! Plan and conduct the interviews in the sequence of roles established in the process map. Explain the purpose, objective, and scope of the interviews and the process maps to the participants to reap effective results. While conducting the interviews, it is vital to identify and establish the input tasks, roles, output tasks, decisions, tasks performed, and linkage to other processes. During this step, every task and decision is uniquely identified.
Step 6: As-Is Process
Describe the activities that help to transform inputs into outputs. It is time to map the actual process. Remember, we want to map the process as it REALLY IS, not what the perfect, ideal, ‘should-be process’ is and NOT what the company guide says the ‘standard operating procedures (SOP)’ are.
Some of the points that need to be considered are the significant activities of the process, decisions, and source of approvals of one step before moving to the next one, areas where multiple methods occur, causes of bottlenecks, extra work and waste, and factors that obstruct process members from performing effectively and efficiently. Carefully list and match all the process steps with their respective roles. Assign correct flowchart symbols and review the process map for proper flow.
Step 7: Analyze, Evaluate, and Sign- off
Review the process steps thoroughly to learn any redundancies, delays, unnecessary steps, ambiguous roles, cycle time, activity lapse, repeated activity flows, bottlenecks, and rework loops. Next is to evaluate the performance of the process. One can use the tools to measure the same using Pareto Charts, Cause and Effect Diagrams, process behavior charts, and process modeling and simulation. Finally, the process improvement plan should be completed, and after a final review by all the stakeholders, it should be signed off.
Where Can You Go Wrong?
Process mapping, no doubt, is a handy tool that facilitates process improvements. But it does not mean that they should be applied everywhere and anywhere. The managers of the organization should be cautious while using process maps. A number of areas have been identified where process maps may go wrong, and these problems are generally related to the use of process maps and the planning and execution of process mapping. Some of the common mistakes with respect to process mapping are illustrated as follows:
Mistake 1: Application of Process Maps on Inadequate Process Types
Business processes are generally categorized as transactional, transformational, and decision-making. Transactional business processes refer to a process where a number of inputs interact with each other to produce specific outcomes. Some of the instances of transactional business processes involve sales activities and call center support functions. Transformational business processes refer to the change in inputs, such as the change in the original shapes of the inputs in their physical or virtual form to produce the outputs. Manufacturing processes and developments in systems are typical examples of transformational processes. Finally, a decision-making business process refers to those processes where the various input parties interact intending to reach any decision. Often, decision-making processes are inventory management, pricing decisions, etc.
Managers sometimes do not differentiate among these business processes before applying the process mapping. Process mapping is most successful in the case of transactional and transformational business processes and not in a decision-making process with open ends. This is because process mapping yields the best results when the outputs can be precisely defined, objective in nature, and the variations in the process are traceable. However, in the case of a decision-making process, there needs to be a lot of information gathering, processing, and analyzing. These processes tend to be intangible and abstract. Hence, managers must avoid the application of process maps on high-end, open-ended decision-making business processes.
Mistake 2: Unclear Focus of Process Mapping
Another mistake managers generally commit is identifying the problem’s causes. There may be a possibility that the real cause of the problem lies outside the scope of the process. In such cases, the process mapping does not reap effective results. For instance, in the hotel industry, the problem identified was related to room service. After mapping the room service process, no real trouble was identified. Later on, it was found that the real issue was not related to service delivery but housekeeping staff over-engaging the lifts in transporting laundry, which caused the delay in room service.
Hence, identify the issue’s correct focus and possible causes. Moreover, it is necessary to identify the focus areas with respect to secondary or primary processes.
Mistake 3: Obsession to Design the ‘Perfect’ Process Map
Sometimes, the business manager becomes so obsessed with designing perfect process maps that they lose focus on developing the process map. When doing so, the business managers visualize and explain the process so that no deficiencies are located, and all individual processes join together and sense logically. Hence, the purpose of creating the process map is totally defeated.
What is a Sub-Process?
A sub-process is a compound activity included within a process. In other words, it is a subset of another primary process. The essential purpose of the sub-process is to subdivide the complex processes into small units to reduce the complexity and make them easy to understand.
The primary advantage of a sub-process is that it simplifies the main process and is easy to understand at a high level. An independent sub-process can often be reused in an extensive process as it does not depend on a particular primary process and can be used without alteration.

Things to Remember to Develop Better Process Mapping:
Following some guidelines, practitioners and business managers can develop effective process mapping. Some of the things that one must remember are:
- Improvement objectives must be clear and continuous
- Use the process mapping only where appropriate
- Employ process architecture to develop process maps
- Study the impact of organizational structures
- Clearly identify multiple responsibilities and tasks
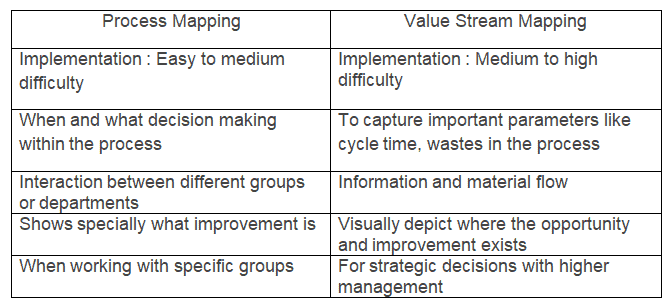
Difference between Process Mapping and Value Stream Mapping (VSM)
Process mapping is a tool that graphically shows a process’s inputs, actions, and outputs in a clear, step-by-step map of the process. Process mapping specifies the tasks within the function and shows the interaction between functions or departments. It helps the participants visualize the process details closely and guides decision-making.
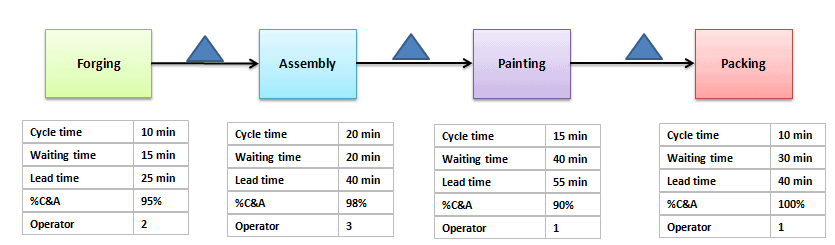
Value stream mapping visually represents the flow of materials and information throughout the organization. It shows the essential parameters like cycle time, lead time, inventory or waiting time, % complete and accuracy, and the number of operators. It helps identify, demonstrate, reduce waste, and create effective flow through all manufacturing or business processes. Three critical steps of VSM:
- Create an as-is current state process of how an organization delivers products and services to the customers.
- Identify wastes in the process and draw the proposed improved state map using lean principles.
- Develop and implement action plans to achieve the proposed improved future state.
Depending on the business requirement, process mapping or value stream mapping can be used in the organization. Use VSM to determine how much time the product spends on each step and waste in the process. Process mapping is used to visualize a series of steps and determine the decision-making within the process.
Moment of Truth
Every single interaction we have with the customer will leave a lasting impression. A moment of truth is a critical touchpoint defining the customer’s relationship with the organization. In other words, it is a moment when a customer interacts with an organization or their product and forms an opinion or impression of that organization and the product, good or bad.
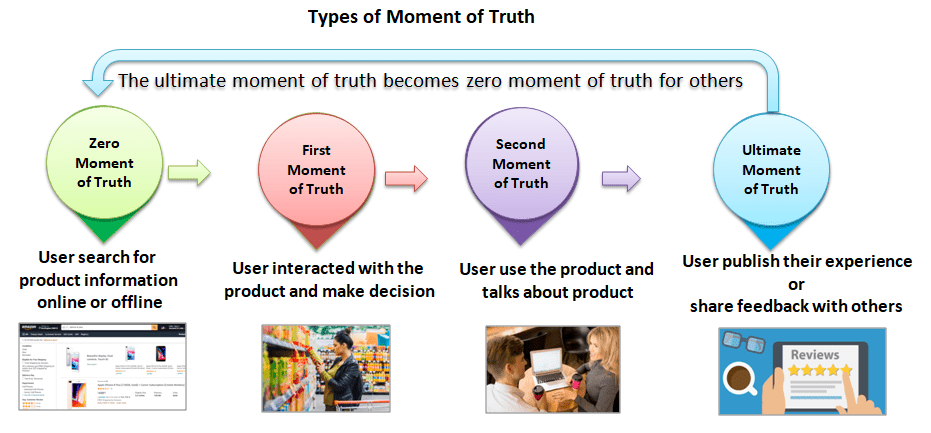
These are the critical points when the customer breaks away or loves your product. Hence, identifying moments of truth is very important for an organization, as it influences the customer’s impression of products or services.
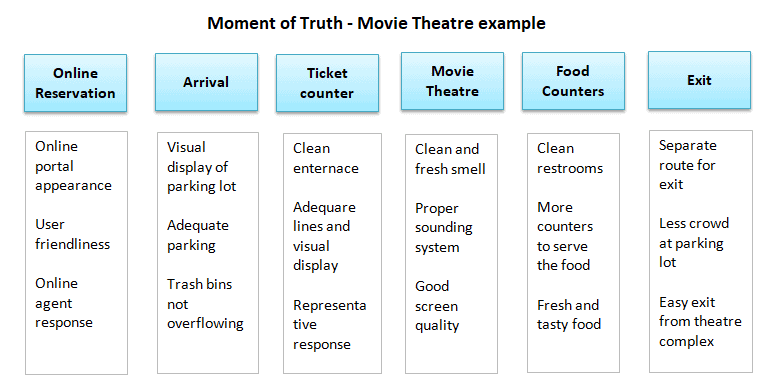
How to Identify Moments of Truth
For the existing product or services, draw the entire process using process mapping and identify the moment of truth points in each stage with the most knowledgeable individuals in your organization.
Example: Below is an example of a moment of truth touchpoint in each stage of watching a movie in a movie theatre.
Questions to Ask While Making a Process Map
- Name of the process. This impacts the scope of the map.
- Identify the starting and stopping points of the process.
- When making a process map, the first thing you must do is clearly define the boundaries of the process
- List the outputs:
- Brainstorm all outputs – critical or not.
- Everything leads to the outputs. (Suppliers, inputs, & process)
- List who gets each output. Match to Define Tollgate #2 (Identify the client’s needs and requirements).
- List the suppliers that provide the inputs to the process.
- List of all of the inputs. (whether or not they are deemed critical)
- Map 5–7 high-level, consecutive steps in the process as it is today.
Process Maps & Root Cause Analysis
Note that Process Maps are NOT a good way to identify & display potential root causes. While it is a good step, it is too broad. Try a 5 Why’s Drilldown, a Fishbone Diagram, or an Affinity Diagram.
Also, see SIPOC.
Process Mapping Videos
Six Sigma Green Belt Certification Process Mapping Questions:
Question: When a Belt is developing a Macro Process Map to define a complex process, he will frequently include activities across various departments to capture all the appropriate activity. He will use _____________ to show which department is responsible for which steps in the process.
A: Subscripts
B: Superscripts
C: Swim Lanes
D: Fence Posts
Answer:
Six Sigma Black Belt Certification Process Mapping Questions:
Question: A Six Sigma team has been formed to improve an existing process. Which of the following tools should the team use first to understand the current process? (Taken from ASQ sample Black Belt exam.)
(A) Flowchart
(B) Pareto chart
(C) Process FMEA
(D) Latin square DOE
Answer:
Question: Which of the following tools can be used to identify waste or non-value-added activities?
(A) Force field analysis
(B) Pareto analysis
(C) Scatter diagram
(D) Process map
When you’re ready, there are a few ways I can help:
First, join 30,000+ other Six Sigma professionals by subscribing to my email newsletter. A short read every Monday to start your work week off correctly. Always free.
—
If you’re looking to pass your Six Sigma Green Belt or Black Belt exams, I’d recommend starting with my affordable study guide:
1)→ 🟢Pass Your Six Sigma Green Belt
2)→ ⚫Pass Your Six Sigma Black Belt
You’ve spent so much effort learning Lean Six Sigma. Why leave passing your certification exam up to chance? This comprehensive study guide offers 1,000+ exam-like questions for Green Belts (2,000+ for Black Belts) with full answer walkthroughs, access to instructors, detailed study material, and more.

Comments (22)
Hi
Please help me to understand the symbols used for
Subscripts
Superscripts
Swim Lanes
Fence Posts
Smita, Please see the Process Map symbol guide here.
Video unavailable
Looks like Youtube took that one down. I’ll find another or have to make my own!
More videos added!
Can we do process mapping to measure outcomes?
Hi Anu,
Process mapping will not give you all of the critical to quality measures you may need to adequately see outcomes. I’d imagine value stream mapping would be a better help.
What are some key differences between process mapping and value stream mapping?
Hi Matthew,
An easy mnemonic is in the terms themselves. The process map maps the process. The Value stream map basically enhances the process map and adds values to it (eg cycle time, percent complete & accurate, NIGO rates, etc).
Best, Ted
Hi Ted nicely explained just one comment i was expecting some hyperlink in below para
“1) Process Maps Help You Uncover Waste
Mapping your process gives you a visual tool where you can uncover waste. I am normally not a fan of commercials but check this one out from GE (remember that GE is a renown adopter of Six Sigma to dramatically improve business results.)”
Thanks, Ehsan.
Looks like the original video was removed. I found another, neat one to replace it.
Thanks!
learning
Glad to be of help, Sibongile.
Good Reading thx.
Will appreciate it if you can tell me how you deal with cross over points, ie. if you are doing mapping for multiple divisions or organisations in a single mapping exercise.
Thanks,
Ian.
Hi Ian,
Sometimes putting every detail on one diagram is not helpful. Or sometimes you want to be able to see sub processes more clearly.
I generally use a numerical icon that corresponds to another tab on visio or is otherwise listed in the table of contents with the packet to denote I’m leaving a page.
Best, Ted
Hi, I am wondering when this article was published for my reference please? Thanks
Hi Abi,
I first published this page on December 21st, 2013. Since then it’s undergone multiple revisions and updates.
If you’re referencing us, I would appreciate a note where.
Best, Ted.
Hi Ted,
I will be referencing in my assignment for the University of Roehampton.
Thanks for your help,
Abi
Hi Ted,
I was looking for a complete guide on process mapping. This article really helps me a lot
Thanks for your help,
Karunesh
Glad to hear it, Karunesh!
Hi Ted,
This is Karunesh Again, can you provide detail Guide on Measurement System Analysis, I want GRR Calculations by Anova, Range & Average Method, By using Microsoft Excel or Minitab
Hi Karunesh,
You should generally be able to find whatever you need by using the search bar on the top navigation bar.
Here is the link to Measurement Systems Analysis.
And here are the links to Gage R & R and ANOVA.
Best, Ted.