Earlier this month, I published a Six Sigma case study. There were a lot of positive responses to it. One response caught my attention:
I want to increase vendor participation in an educational organization for economic development. How would I identify defects in a process? Then how do I recommend an improved process?
My current process includes sending emails, mail, calls, and hosting workshops in the community. What statistical information do I gather in order to show my recommendations for improvements?”
Good questions. Even with training, applying Six Sigma concepts to the real world is sometimes difficult.
That’s where I come in.
Six Sigma can be about defects. It can also be used to focus on a specific behavior or outcome to encourage, such as a vendor hosting a workshop. If we concentrate on targeting outcomes and leverage a process map, we can create a clear framework for improvement.
Here’s how your approach integrates into the broader Six Sigma framework:
1. Define the Problem and Objectives
Problem Statement: Define what you perceive as a defect in the current process. Explain how to increase vendor participation. For instance, is it low response rates? Lack of vendor engagement? Or insufficient conversion from initial contact to the active involvement?
Decide on the specific behavior or outcome to encourage. In this example, it’s getting a vendor to host a workshop.
Objective: Set specific, measurable goals. Decide on the particular behavior or outcome to encourage. For example, “Increase vendor participation rate by 30% within the next fiscal year.”
2. Measure the Current Process
This step involves collecting data to understand the current performance. Then, it identifies areas for improvement. In this case, we could consider gathering statistical information on:
- Response Rates: Track the response rates to emails, mail, and calls. This includes the number of responses compared to the number of contacts made.
- Engagement Levels: Measure engagement levels from workshops and community events, such as attendance rates, active participation, and follow-up actions.
- Conversion Rates: Track how many vendors move from initial contact (awareness) to active participation (engagement and contribution).
Process Mapping: Outline the process phases you go through with vendor contact.
If the process has never been mapped before, you may have to stop here and do so.
Every repeatable set of actions we take in pursuit of an outcome is a process. That doesn’t mean it’s the correct process! But a process already exists, whether it’s been defined or not.
If a process hasn’t been defined, you must map it.
Let’s say this is the process of cold-calling area vendors to have them host a workshop:
Vendor outreach -> Initial meeting -> Pitch to the Vendor -> Agreement -> Event Planning -> Delivery of the Workshop.
3. Analyze the Data
Use the collected data to identify patterns, bottlenecks, or defects in the process. Techniques like Pareto analysis can help you focus on the most significant issues. Cause-and-effect diagrams (Ishikawa/fishbone diagrams) can help identify the root causes of low participation.
Process performance metrics can be especially useful here.
Roll-through Yield (RTY): Use historical data to calculate the RTY for each phase of the process. This involves tracking the percentage of vendors that successfully move from one phase to the next. It clearly shows where drop-offs occur and where the process is most and least efficient.
Here’s one example of what that could look like:

From here, you could do further analysis. You could quantify which step would give you the most significant improvement in the overall process results.
You could also use tools like a fishbone diagram to help brainstorm possible reasons for low numbers at each step.
Potential Hypothesis Tests
From there, you could segment your population. Then, run a variety of hypothesis tests to determine which, if any, population segments (e.g., company size, industry, revenue, etc.) truly impact acceptance.
Here are a few examples:
Chi-Square Test of Independence
Purpose: To determine if there is a significant association between two categorical variables. For example, you could use this test to examine if the response rate to vendor outreach (yes or no) is independent of the method of communication used (email, mail, calls, workshops).
Application:
This test could help identify the most effective communication methods for engaging potential vendors. It could also highlight areas for process improvement.
Collecting Data
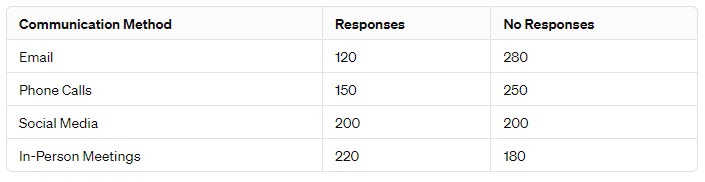
We collect data on the number of engagements (responses) and non-engagements (no responses) for each communication method over a certain period. Here’s an example dataset:
Hypotheses Formulation
- Null Hypothesis (H0): There is no association between the communication methods and vendor engagement levels. (The method does not affect engagement.)
- Alternative Hypothesis (H1): There is an association between communication methods and vendor engagement levels. (The method affects engagement.)
Conducting the Chi-Square Test
We’ll use the Chi-Square Test of Independence to analyze the data. This test compares the observed frequencies (our data) to the expected frequencies. The expected frequencies are what we would predict if there were no associations between the variables.
Calculation
Let’s calculate the Chi-Square statistic based on our data.
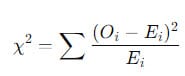
First, we calculate the expected counts for each cell in the table. We assume the null hypothesis is true. Then, we compute the Chi-Square statistic using the formula:
- Chi-Square Statistic: 63.96
- P-Value: 8.37×10⁻¹⁴

Conclusion
We’ll compare the calculated Chi-Square statistic to a critical value from the Chi-Square distribution table. We use a certain significance level, commonly 0.05. If our statistic exceeds the critical value, we reject the null hypothesis. This shows a significant association between communication methods and engagement levels.
Given the p-value is much lower than 0.05, we reject the null hypothesis. This indicates a statistically significant association between the communication methods and the engagement levels of potential vendors.
The results suggest that the method of communication significantly affects engagement. This highlights areas for process improvement. Specifically, based on the observed data, Social Media and In-Person Meetings show higher effectiveness than Email and Phone Calls.
One-way ANOVA (Analysis of Variance)
- Purpose: To compare the means of three or more independent groups to see if at least one differs significantly. This could be applied to analyze whether there are significant differences in engagement levels or success rates across different workshops or events.
- Application: If significant differences are found, it could indicate that certain types of workshops are more effective in encouraging vendor participation and improving event planning and execution.
Paired Sample t-Test
- Purpose: To compare the means of two related groups. This could be applied to measure the effectiveness of a particular process or strategy on the same group of vendors before and after an intervention.
- Application: For instance, evaluating the change in response rates to follow-up communications after enhancing the personalization of the message content.
4. Improve the Process
Strategic improvements could include better pre-qualification of leads to ensure higher engagement rates. Alternatively, improving the pitch to increase agreement rates could also be a strategy. The specific improvements would be targeted based on the identified defects in the process.
Based on your analysis, develop strategies to eliminate the identified defects. This could involve:
- Improving Communication Channels: Optimizing the mix of emails, mail, calls, and workshops based on what’s most effective. This may require A/B testing different approaches to see what yields higher engagement. Depending on the need, a Design of Experiment could be helpful here. It could be that multiple redundant communications across channels are more effective than any single channel. The only way to know would be to design and test an experiment!
- Enhancing Workshop Content and Delivery: If workshops are a vital strategy, consider improving the content, making it more interactive, or changing the format to meet vendor needs and interests better.
- Personalization: Tailor communications and interactions to potential vendors’ specific interests and needs to increase engagement.
Experimentation: Implement changes on a small scale to test their effectiveness. For instance, trying different pitching techniques or criteria for pre-qualifying leads to see what improves the RTY.
Statistical Testing in the Improve Phase
We may see a difference once we make a change and test it in the improvement phase. But is it a real difference we can count on, or are we just assuming it is?
Depending on how critical it is that we get this improvement right, we may want to validate our results with another hypothesis test.
Here’s one way we might do that:
Two-Sample t-Test
- Purpose: To compare the means of two independent groups. This test could compare the success rates of vendor agreements before and after a particular improvement was implemented—for example, a change in the pitch process.
- Application: This would directly assess the effectiveness of specific changes made in the Improve phase, providing statistical evidence of improvement (or lack thereof).
5. Control and Monitor
Once the problem has been solved, implement the improvements and establish a system to monitor the process continuously.
Monitor RTY: After implementing changes, continuously monitor the RTY for each phase to assess the impact of the improvements. Adjust strategies as needed based on real-time data.
Establish KPIs: Beyond RTY, establish other relevant key performance indicators (KPIs). For example, include vendor satisfaction, quality of workshops delivered, response, conversion, and overall engagement rates. This ensures that process improvements translate into desired outcomes.
Document Your Findings and Recommendations: Compile a comprehensive report. The report should detail your findings, the improvements you implemented, and the observed results. Include statistical evidence to demonstrate the effectiveness of the changes, such as before-and-after comparisons of response rates, engagement levels, and conversion rates.

Conclusion
Systematically following these steps can identify defects in the current process. Then, you can recommend improvements based on solid statistical evidence. This approach helps achieve the immediate goal of increasing vendor participation and establishes a culture of continuous improvement within the organization.
When you’re ready, there are a few ways I can help:
First, join 30,000+ other Six Sigma professionals by subscribing to my email newsletter. A short read every Monday to start your work week off correctly. Always free.
—
If you’re looking to pass your Six Sigma Green Belt or Black Belt exams, I’d recommend starting with my affordable study guide:
1)→ 🟢Pass Your Six Sigma Green Belt
2)→ ⚫Pass Your Six Sigma Black Belt
You’ve spent so much effort learning Lean Six Sigma. Why leave passing your certification exam up to chance? This comprehensive study guide offers 1,000+ exam-like questions for Green Belts (2,000+ for Black Belts) with full answer walkthroughs, access to instructors, detailed study material, and more.
