Sample size determination is the mathematical estimation of the number of population units considered for the study. In other words, it is the subset of the population selected to make inferences about the population. It must be adequate to represent the population.
How Large Should a Data Sample Be?
The sample size is the number of observations collected from a population; it is a subset of the population to make inferences about the population. Moreover, determining sample size is an important element of every survey based on sampling.
When you pick an SS, there will always be a tradeoff between precision and cost. This trade-off depends on:
- The type of data being sampled (continuous or discrete)
- How precise do you want your statistical inferences to be?
- The estimate of the standard deviation for the entire population.
- The confidence level desired.
Sample size needed for hypothesis testing depends on:
- Desired Risk (Both alpha and beta)
- The minimum value to be detected between the population means
- The population variance is the variation in the measured characteristic (S or sigma).
- Population size does NOT come into the determination of how big a population is.
Why Use Data Sampling?
Sometimes trying to gather information on a complete population is too expensive, time-consuming, or nonsensical.
For example, we might take samples when:
- The process we are measuring would require destructive testing (think taste tests, car crash tests, etc.)
- Getting data from the entire population is too expensive or would take longer than we have.
- Getting total population data is just too hard.
For example, CNN’s coverage of an election cycle in the United States makes it impossible to ask every voter how they voted. Even if it were, not all would answer. Instead, they use exit polls to derive statistical conclusions about the population as a whole. In a DMAIC sense, this is most common in the Measure phase.
We would unlikely use sampling when the events and products are unique and cannot be replicable.
To get around these constraints, black belts or statisticians extract the samples from the statistical population and make inferences about the population.
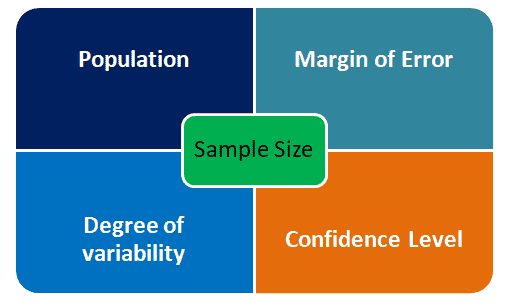
Factors Affecting Sample Size(SS)
In a quantitative study, SS selection depends on the population, the margin of error, the confidence level, and the degree of variability.
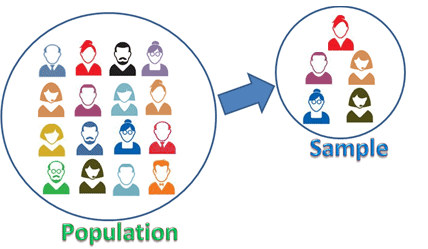
Population: Population is the group of elements which has common characteristics. It is a collection of observations we would like to make inferences about.
Sample: A sample is the subset of the population
Margin of Error
The margin of error is a statistic expressing the amount of random sampling error in the results of an experiment. It determines how much higher or lower the population means you are willing to let your sample mean fall. Often margin error is expressed in terms of percentage.
Confidence Level
The Confidence level is the estimated probability that a population estimate lies within a given margin of error. In other words, it tells how confident you want to be that the actual mean falls within your confidence level. The most commonly used confidence levels are 90%, 95%, and 99%.
Degree of variability
The degree of variability is the extent to which the sample measures differ from the measure of the population. The greater the variance, the larger the sample size.
How to Calculate a Sample Size
Regarding Six Sigma, we are usually trying to determine an appropriate sample size for doing one of two things; estimate an average or a proportion. The equation you use to determine your SS depends on what you’re going to do with that sample.
Either way, the variables are as follows:
n = sample size (what we’re solving for)
d (Sometimes represented as delta or Δ) = precision = the range for an estimate of a characteristic = half the width of a confidence interval.
Precision in this sense can be a bit tricky, so here are a few examples;
- Estimate of a lead time of +/- 4 days
- precision would = 4 days.
- Estimate of a percent rejected +/- 10%
- precision would = 10%
- 95% CI (4,10) for a lead time in hours.
- Estimate of a lead time between 4 and 10 hours
- Width of the confidence interval would be = 10-4 hours = 6 hours
- precision = d = 1/2 of C.I. width = 6/2 = 3 hours
Sample Size(SS) calculation decision guide
- Sample size determination is the mathematical estimation of the number of population units to be included in the study. It must be adequate to represent the population. The determination should be optimum and has to be obtained by the scientific method.
- If the SS is 30 or more, it is known as a large sample
- For large samples, the sampling distribution of statistics is normal (Z distribution)
- For small SS (<30), the sampling distribution is t, F, and chi square distribution
- The value of statistics obtained from a large sample can be taken as an estimation of the population parameters.
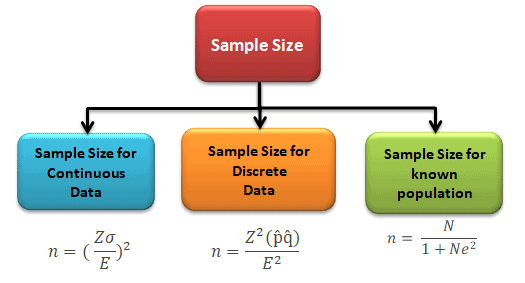
Sample Size for One Sample, Continuous Outcome
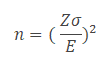
Where n is the SS, Z is the Z score from the desired risk, sigma is the standard deviation, and E is the mean shift – or error.
Example: A Peanut Butter Manufacturer wants to estimate the sugar content in a bottle. In fact, the previous batch of 1000 bottles had a standard deviation of 10 gms. Identify the sample size to estimate the mean is within 4 gms of the population mean with a 95% confidence.
- Margin of error E = 4gm
- Standard deviation = 10gm
First, we need to identify the alpha
Subtract the confidence level (95%) from 1 and then divide the result by two
α=(1-.95)/2= .025
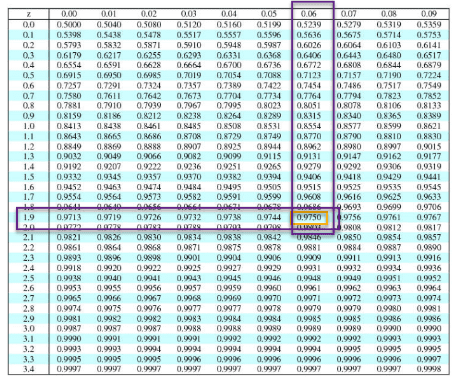
Next, subtract alpha from 1 and then look that is up in the middle of the z table to get the z-score
1-0.025 =0.975
Z-score=1.96
So, Sample size n = (z* σ/E)2 = (1.96* 10/4)2 = 24.
Also see: https://sphweb.bumc.bu.edu/otlt/mph-modules/bs/bs704_power/BS704_Power3.html
Sample Size for Continuous and Binary Random Variables
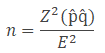
Where
n = SS
p̂ is the variability.
q̂=1- p̂
Example: The expectation is that 20% of employees in the New York area are using Subway. With 90% confidence level, what would be the minimum sample that needs to estimate the population proportion with a maximum permissible difference of 6%?
Sample proportion=0.20
Margin of error E =0.06
90% confidence level α = 1-0.90 = 0.1; Z =1.645
So, SS = p̂ (1- p̂)* (Z/E)2 = 0.2*(1-0.2)* (1.645/0.06)2 = 120.26 =121.
Also, see:
(Cochran’s formula) https://www.statisticshowto.com/probability-and-statistics/find-sample-size/
Sample Size for Known populations (Solvin’s Formula)
Solvin’s formula is used to compute the sample size in a study for a given total population and a margin of error. Slovin’s formula works for simple random sampling. Moreover, it computes the number of samples required when the population is too large.
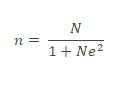
Where
n = sample size
N= total population
e=margin of error
Example: Compute the SS for a population of 1200. You need to take a survey about financial problems. While the margin of error is 5%.
Population N =1200
Margin of error E =0.05
So, SS = N/(1+Ne2)= 1200/(1+1200*0.052) =1200/4=300.
SS for Discreet Data
Also see: SS for a Known or Finite Population
https://blog.remesh.ai/how-to-calculate-sample-size
https://www.calculator.net/sample-size-calculator.html
How to Find a SS Given a Confidence Level and Width (known population standard deviation): https://www.statisticshowto.com/probability-and-statistics/find-sample-size/
Also see: SS for an Unknown or Infinite Population
https://www.surveymonkey.com/mp/sample-size-calculator/
Also see: SS for Other Data Types (Nominal, Ordinal, Interval, Ratio)
See:
How to Calculate SS Videos
Formulas for various scenarios
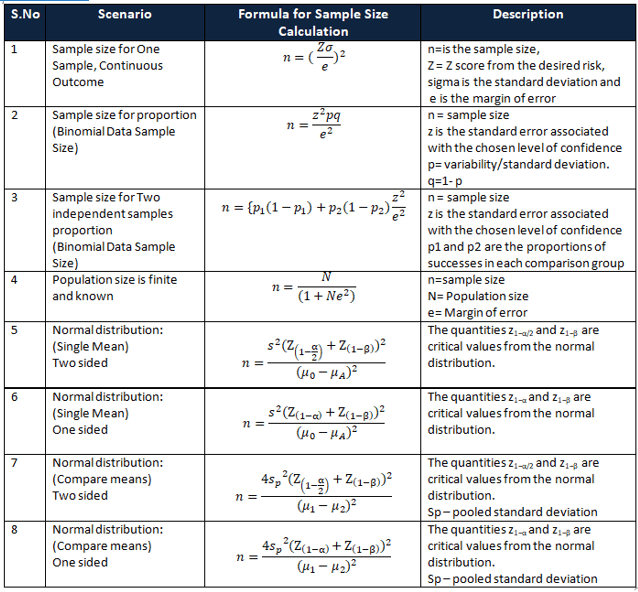
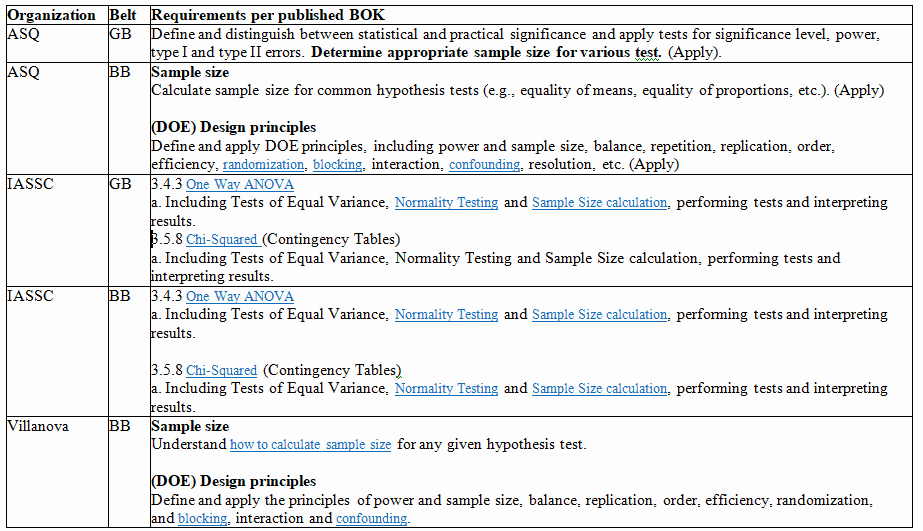
Sample Size and Hypothesis Tests, Designed Experiments
In addition to basic SS calculations, Six Sigma candidates are often required to understand how to calculate appropriate SS for use in hypothesis tests and in Designed Experiments. Here are 2 charts I’ve assembled taken from requirements explicitly stated in the ASQ, IASSC, & Villanova Green Belt and Black Belt BOKs.