What is a Check Sheet?
A Check Sheet is an important tool for effective data collection and analysis. It is a form used to collect required data in a systematic and organized manner.
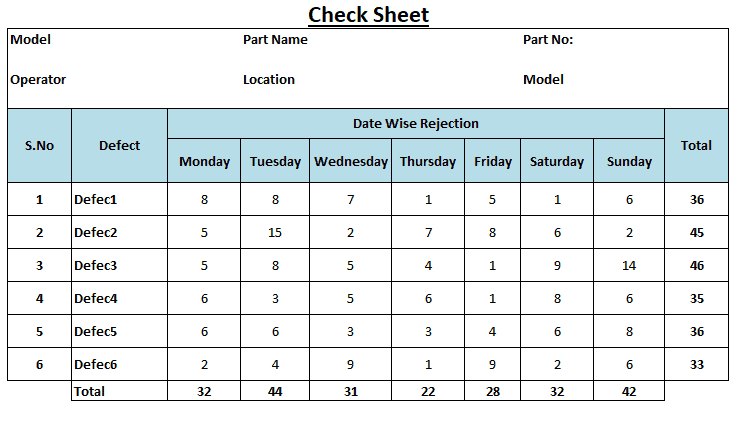
A Check Sheet is a data collection tool that usually identifies where and how often problems appear in a product or service. In other words, it is a blank form used to systematically collect and organize data on a factual basis at the location where the data is generated.
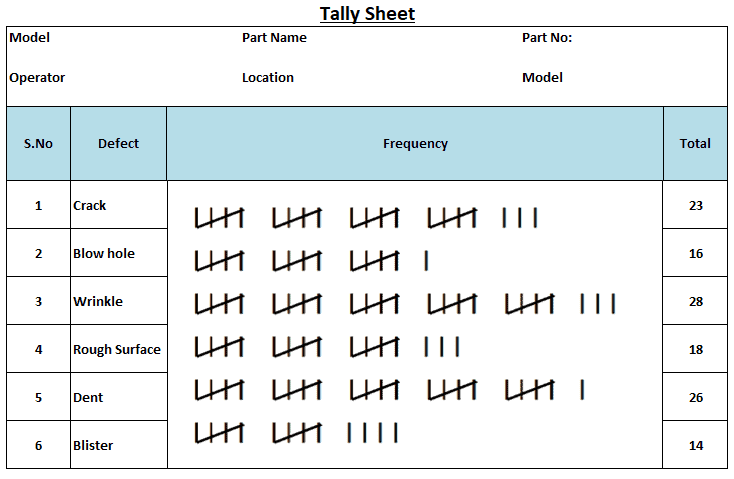
It is specifically designed for the process being investigated. Both variable and attribute data can be recorded on this sheet. The collected data can be qualitative or quantitative. If the data is quantitative, often, it is called a tally sheet. The data collected can be used as input for other quality tools such as histograms, bar graphs, and Pareto charts.
When Would We Use a Check Sheet in a Six Sigma Project?
It is a highly proven method in many industries for business process improvements.
- To collect data manually.
- To capture the shift, machine, and operator production data.
- When collecting frequency data and identifying patterns of rejections, defect location, and defect causes.
- To capture product and process-related parameters to ensure quality.
Why Do We Record Check Sheets
Check Sheets are one of the famous 7 QC process improvement tools. It is used for measuring data during the Measure phase of DMAIC. Generally, it is a table with defined rows and columns. Operators enter one checkmark for each data point or defect. They are also used for traceability purposes.
How to Create Check Sheets
- Determine what information to capture. In other words, what defect or problem data to collect.
- Establish the data collection frequency.
- Construct the form, including title, date/time, location, name of the operator, and categories.
- Test the form with three or four operators to ensure that the important information is captured and that it is easy to use.
- Train the operators on the usage of form.
- Get the final approval to use the form.
Different types of Check Sheets
- Production process distribution check sheet
- Defect location check sheet
- Defect cause check sheet
- Defective item check sheet
- Check-up confirmation sheet is nothing but a checklist
Benefits
- To provide documentary evidence of data collection
- Helps to create histograms, bar graphs, and Pareto charts
- Monitor the process performance and also easy to use
- To provide a base for future reference
- Quantify defects by type, location, and cause
- It helps to identify the frequency of the problem occurring
Checklists vs. Check Sheets
A Check Sheet is a 7 QC process improvement tool for capturing and categorizing observations. The checklist is a mistake-proofing aid to ensure all the important steps or actions have been taken, especially when checking or auditing the process outputs.
A Check Sheet is used to collect the data, whereas a checklist marks the accomplishment. A checklist is a tool used to organize work effectively and to efficiently verify the most critical tasks.
An Example of Creating and Using a Check Sheet
The following are examples of a Tally Sheet. To create a Tally Sheet, list the type of non-conformance, tally the number of times it happens, and sum the total. Furthermore, a Tally sheet easily turns into a Pareto chart.
Excel Template
What is a Measles Chart
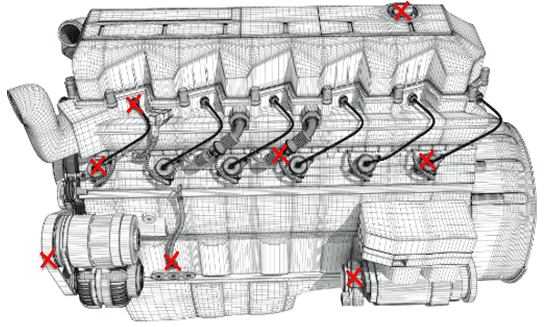
A Measles Chart, also known as a defect location check sheet, is a visual tool for collecting data. It is commonly used to record location data and shows problems in a geographic area.
When Would You Use a Measles Chart?
Use the Measles Chart specifically to analyze a problem’s location and density, not just to collect the count of problems. In addition, Measles Charts help determine where the common defects on parts are located.
How to use Check Sheets Along Side Measles Charts
The Check Sheet monitors the number of defects and percentage of defects; simultaneously, Measles Charts help identify the defects’ location.
In a manufacturing scenario, draw a picture of the part. Whenever a defect is identified, the operator has to mark it on the picture where the defect has occurred.
An Example of a Measles Chart
Example: A big red x on the engine area on a car image given to you by AAA shows that you need to change your oil.
Also, see Problem Identification.
Helpful Video
Six Sigma Black Belt Certification Questions:
Question: Which of the following tools would be most appropriate for collecting data to study the symptoms of a problem? (Taken from ASQ sample Black Belt exam.)
(A) Check Sheet
(B) Flow diagram
(C) Force-field analysis
(D) Activity network diagram
Answer:
When you’re ready, there are a few ways I can help:
First, join 30,000+ other Six Sigma professionals by subscribing to my email newsletter. A short read every Monday to start your work week off correctly. Always free.
—
If you’re looking to pass your Six Sigma Green Belt or Black Belt exams, I’d recommend starting with my affordable study guide:
1)→ 🟢Pass Your Six Sigma Green Belt
2)→ ⚫Pass Your Six Sigma Black Belt
You’ve spent so much effort learning Lean Six Sigma. Why leave passing your certification exam up to chance? This comprehensive study guide offers 1,000+ exam-like questions for Green Belts (2,000+ for Black Belts) with full answer walkthroughs, access to instructors, detailed study material, and more.
