Quality is a tricky, slippery word that changes definition depending on its context. You’ll hear very different answers if you ask, “What is quality?” in a group of engineers vs. regular folks.
The ASQ defines it like this:
A subjective term for which each person or sector has its own definition. In technical usage, quality can have two meanings: 1) the characteristics of a product or service that bear on its ability to satisfy stated or implied needs; 2) a product or service free of deficiencies. According to Joseph Juran, quality means “fitness for use”; according to Philip Crosby, it means “conformance to requirements.”
ASQ Quality Glossary
So, let’s unpack this definition.
The subjective term
In everyday usage, ‘quality’ is a nebulous word. It denotes something a person likes and considers that they can use with minimal disruptions. Typically, it meets their needs and some of their wants. It can be aspirational – something we can’t afford must be better quality than we can. Why is it important to consider this subjective and everyday definition when approaching ‘quality’ from a professional and more objective viewpoint? Because this is the understanding of ‘quality’ that many of your end customers may have. Therefore, you need to keep it in mind.
Quality is when the customer returns and the product does not.
Tim Robertson
Meeting requirements
Being able to meet requirements is a much more objective definition than the previous one. Right? Yes – and no. The vagueness in ‘meeting requirements’ comes from two main issues:
- What are the requirements?
- How do we measure ‘meeting’ those requirements?
These might seem nitpicky points; however, a lack of understanding here can negatively affect a business. Anyone in customer-facing roles can tell you that customers often have unstated and unexpected requirements for the most mundane items. A person who orders a sandwich will complain that it wasn’t toasted–when they didn’t specifically ask for it. A person who buys the cheapest available computer will complain that it performs poorly at running a resource-intensive game– when they didn’t specify what they wanted the computer for.
Here’s the critical point: requirements can be nebulous or concrete, and the terms for meeting them can be measurable.
Free from deficiencies
The ASQ presumably uses ‘deficiencies’ as a catch-all to cover defective and unfinished units. But let’s focus on defects because this is one of the primary points of a Six Sigma project–eliminating defects in the end product improves its quality. In this sense, ‘quality’ can be measured and tracked.
What is Quality? Videos
Reliability

As a consumer, how would you feel if a favorite product changed entirely and without warning? And when you complained, the manufacturer simply told you that the product description was still accurate, so it was OK?
For example, say you enjoy a specific brand’s cheese-flavored potato chip. One day, you open a packet and bite into one, and the flavor has changed from cheddar to Stilton. Everything else about the chip is still precisely the same–size, crunch, saltiness, and fattiness. The quality of the chip is still, technically, high. But there’s a good chance you’ll be annoyed and feel let down if you weren’t warned about this change. This is part of the reliability factor.
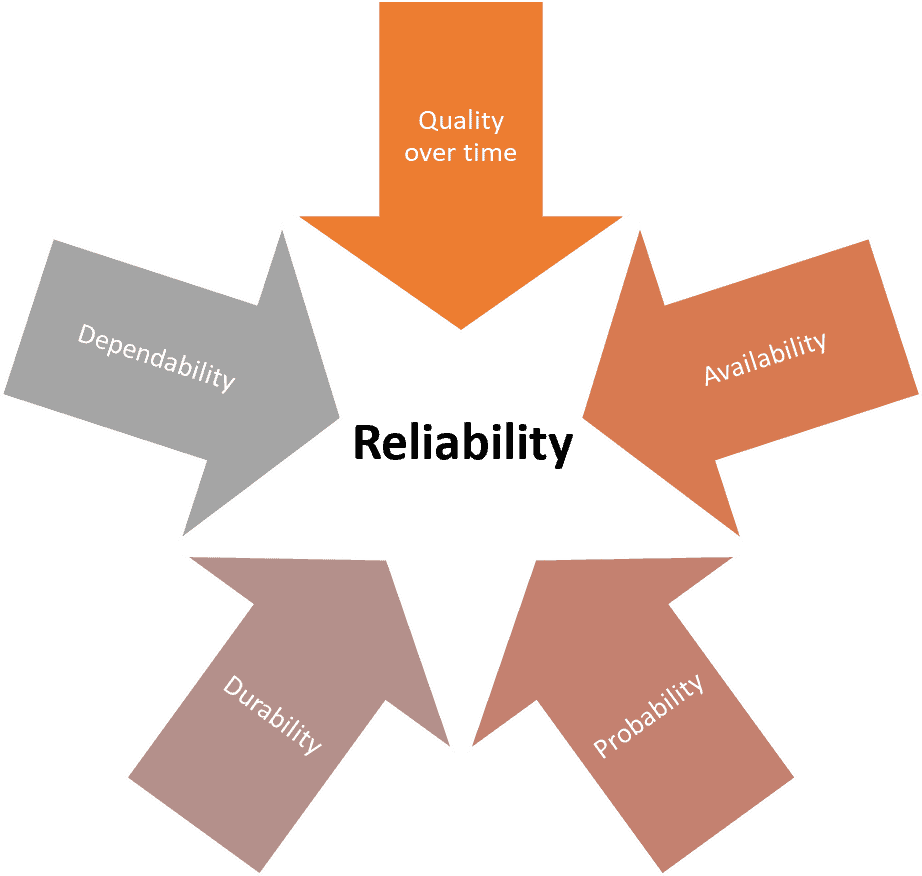
The other part of the reliability factor is that a product continues to exhibit a quality performance for a set period. The ASQ defines reliability as:
The probability of a product performing its intended function under stated conditions without failure for a given period of time.
ASQ Quality Glossary: Reliability
Quality & Reliability
Quality and reliability are intertwined concepts. You can also look at reliability as the effect of quality over time.
Let’s look at a real-life example.
You buy a new car from a dealer. It comes with a 7-year warranty and free servicing during the warranty period. The manufacturer is essentially promising you this: This is a quality product with no defects and will continue to work as promised for seven years without developing defects. If it does develop any defects, we’ll fix them for you.

A reasonable expectation on the part of the customer would be that the quality of the car will not degrade significantly in seven years.
Quality and Design
These two factors are strongly connected. Good design leads to better quality – and reliability. Conversely, bad design leads to faulty and unreliable items.
Use Design for Six Sigma (DFSS) to improve and develop your product designs.
Defects vs. Defectives

A defect is an imperfection – a flaw or departure from the ideal. A defect can be large or small, rendering a product unusable or only outside specifications.
A defective item, on the other hand, doesn’t function as required. For this to happen, the item will have one or more defects. But an item with a defect isn’t defective if it still functions as required.
Let’s look at a couple of examples.
Defect: One page of a book contains a typo.
Defective: A book falls apart when it’s picked up.
Defect: A customer ordered a burger with tomato, but the burger delivered to them did not contain tomato.
Defective: A burger patty is undercooked and represents a health risk; the customer cannot safely eat it.
Products with defects can still be used for their original purpose, although the customer experience may be sub-optimal. Defective products cannot be used for their original purpose without danger or severe inconvenience to the customer.
Problem Identification
Use these tools in problem identification:
- Check Sheets: Identify where and how often problems appear in a product or service.
- Pareto Charts: Pinpoint the most frequently occurring problems or defects.
- Project Charters: Clearly document the scope and business impact of the problem the Six Sigma team is attempting to solve.
Life Cycle Cost & Quality
Life cycle cost is the total amount you pay for a product over its lifetime. It includes factors like:
- Purchase price
- Value depreciation
- Operating costs
- Maintenance expenses
- Repair costs
- Disposal costs at end of life
High-quality products tend to have lower life cycle costs, despite often having an initial higher purchase price, because they:
- Don’t break down as often, requiring fewer repairs.
- They are built to minimize wear and tear, reducing required maintenance.
- They will often be more efficient in using resources like electricity and water.
- Hold their value better over time, because people are more willing to buy them secondhand.
Reliability Measures
Two common reliability measures are mean time to failure (MTTF) and mean time between failures (MTBF).
Mean time to failure
The average time that an unrepairable product will take to fail. This metric is for products that either can’t or shouldn’t be repaired, like light bulbs or fan belts. The reason for not repairing might be safety (a patched tire is more likely to blow out than a new tire) or cost-effectiveness (a faulty flash drive might be repairable, but the repair would cost a lot more than the replacement).
Mean time between failures
The average amount of time that a repairable system will run without a breakdown. For this metric, it’s important to understand what constitutes a failure. A failure:
- Is unscheduled
- Stops the system from functioning, and;
- Requires a repair to be made.
Scheduled maintenance periods, even if they involve shutting down the system, do not count as failures. Issues that arise and require repair, but don’t shut down the system, also don’t count as failures.
FRACAS
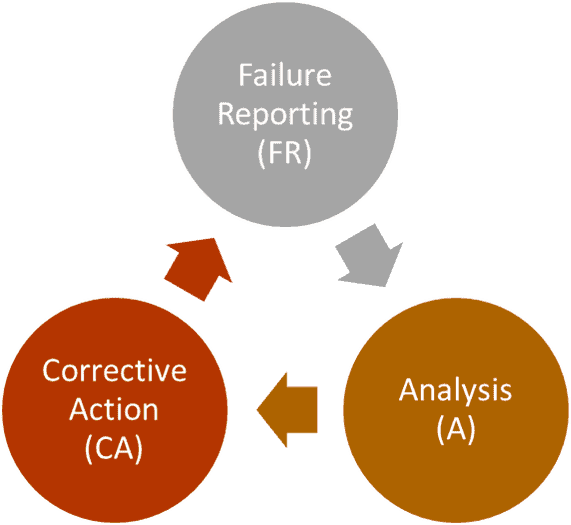
All this talk of quality and reliability brings us to one of the key methods for finding and fixing problems in the design and production of items. The Failure Reporting Analysis and Corrective Action System (FRACAS) originally came from the military and defense industries in the 1970s. As you can probably imagine, high-quality and reliable systems are paramount in these industries.
What is a FRACAS?
A FRACAS is a process we can use to solve issues at every stage of producing a new product, from design to deployment. It involves:
- Recording information about existing issues.
- Prioritizing the list from most to least urgent or important.
- Finding and implementing solutions so that the issues don’t happen again.
- Documenting data from the recording and fixing stages to provide reliability reports.

How to create a FRACAS
Step 1: Report the failure
Develop a report template that includes:
- The name of the person writing the report.
- When: the time and date of the failure.
- Who: the person responsible for noticing or witnessing the failure.
- Where: the machine or location of the failure.
- How: the steps that led to the failure.
- What: anything that was done to attempt to correct the failure.
- Next: options for changing a process or situation to ensure that the failure doesn’t reoccur.
Step 2: Analyze the failure
Designate a person in charge of delegating the analysis. Because there can be more than one type of failure, it’s typically self-defeating to have a single team always assigned to analyze a failure. You might need engineers to analyze a stress tolerance issue or a Six Sigma specialist to analyze a process issue. Once they’ve found the root issue, they need to develop a solution.
The responsible person needs to look at each issue, identify the best people to deal with it, delegate to them, and then chase up the analysis as required.
Step 3: Correct the failure
Once the analysis team has come up with a solution, someone needs to implement it. Again, who this will be can depend a lot on the actual issue being fixed. Your main mission at this point is to ensure that someone is responsible for taking the solution and turning it into reality. In smaller organizations, this might be the same person overseeing the analysis stage. They don’t have to be an expert in specific implementation; they do need to be good at finding the right person and motivating them to implement.
Example FRACAS scenario
Let’s look at a simplified example scenario and then walk through the FRACAS cycle for it.
Failure
A nozzle jams on a cookie extrusion machine. This causes a backflow of cookie dough onto the floor of the factory.
Failure report
| Person reporting | Danni Lewis |
|---|---|
| Date/time | 20:43, 03/31/2020 |
| Witness | Spike Smith |
| Location | Machine 74W |
| Failure | Jammed nozzle caused dough backflow from top of machine. |
| Steps leading to failure | 1. Added dough mix 41. 2. Added wet ingredients. 3. Turned machine on. |
| Corrective action | Tried turning machine off and on again. Did not help. |
| Suggestions | This isn’t the first time this has happened since we changed the mix. |
Analysis
A manager gets the report and assigns the issue to the factory’s lead engineer. The team looks at the machine in question. They find that the nozzle is blocked, as expected. But why? A comment on the report gives them a key clue. This isn’t the first time it’s happened, and it seems more frequent since a recipe change. Did anyone recalculate the machine requirements after changing it? It turns out this step was missed. No one noticed that the new mix is a bit thicker and needs a wider nozzle. They run a few simulations. Sure enough, a wider extrusion nozzle should fix the issue.
Corrective action
The manager gets the analysis back from the team. OK, they’ve found the cause and suggested a fix. The next task is to put that fix in place. She assigns the fix to the mechanic team. They take the engineers’ recommendations and order a couple of new, wider nozzles. They test these new nozzles for two weeks. In that time, one of the non-fixed machines backflows. The fixed ones don’t. So, they expand the test to all extruders. Once they’ve had a two-month period with no backflow incidents, they close the issue.
What is Quality? Additional Articles
When you’re ready, there are a few ways I can help:
First, join 30,000+ other Six Sigma professionals by subscribing to my email newsletter. A short read every Monday to start your work week off correctly. Always free.
—
If you’re looking to pass your Six Sigma Green Belt or Black Belt exams, I’d recommend starting with my affordable study guide:
1)→ 🟢Pass Your Six Sigma Green Belt
2)→ ⚫Pass Your Six Sigma Black Belt
You’ve spent so much effort learning Lean Six Sigma. Why leave passing your certification exam up to chance? This comprehensive study guide offers 1,000+ exam-like questions for Green Belts (2,000+ for Black Belts) with full answer walkthroughs, access to instructors, detailed study material, and more.

