

An F-Test uses the F-distribution to determine whether two independent estimates of population variance differ significantly. It’s the tool behind ANOVA’s equality-of-means test and behind checking whether two samples come from populations with equal variance.
What is an F-Test?
The F-test determines whether the two independent estimates of population variance differ significantly. In this case, the F-ratio is:
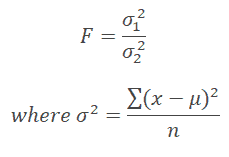
or
To determine whether the two samples drawn from the normal population have the same variance. In this case, the F-ratio is:
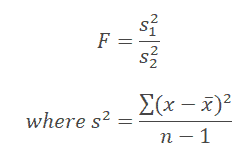
In both cases, σ12 > σ22, S12 > S22, in other words, a larger estimate of variance always be in the numerator and a smaller estimate of variance in the denominator.
Degrees of freedom (ϑ)
- DF of larger variance (i.e., numerator) =n1-1
- DF of smaller variance (i.e., denominator) =n2-1
What is an F-Statistic?
F-statistic, also known as F-value, is used in ANOVA and regression analysis to identify whether the means between two populations are significantly different or not. In other words, F-statistic is the ratio of two variances (Variance is nothing but a measure of dispersion; it tells how far the data is dispersed from the mean). F-statistic accounts for corresponding degrees of freedom to estimate the population variance.
F-statistic is almost similar to t-statistic. The T-test states whether a single variable is statistically significant or not, whereas the F-test states whether a group of variables is statistically significant.
F-statistics are based on the ratio of mean squares. F-statistic is the ratio of the mean square for treatment or between groups with the Mean Square for error or within groups.
F = MS Between / MS Within
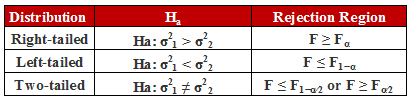
If the calculated F-value is greater than the appropriate value of the F critical value (found in a table or provided in software), then the null hypothesis can be rejected. (helpful in ANOVA)
The calculated F-statistic for a known source of variation is found by dividing the mean square of the known source of variation by the mean square of the unknown source of variation.
When would you use an F-Test?
There are different types of F tests, each for a different purpose.
- In statistics, an F-test of equality of variances is a test for the null hypothesis that two normal populations have the same variance.
- The F-test tests the equality of several means. At the same time, ANOVA tests the equality of means.
- F-tests for linear regression models are to test whether any of the independent variables in the multiple linear regression are significant or not. It also indicates a linear relationship between the dependent variable and at least one of the independent variables.
Steps to Conduct an F-test
- Choose the test: Note the independent and dependent variables and assume the samples are normally distributed.
- Calculate the F statistic and choose the highest variance in the numerator and lowest variance in the denominator with a degree of freedom (n-1).
- Determine the statistical hypothesis.
- State the level of significance.
- Compute the critical F value from the F table. (use α/2 for a two-tailed test)
- Calculate the test statistic.
- Finally, draw the statistical conclusion. Reject the null hypothesis if the test statistic falls in the critical region.
Examples of Using an F-Test in a DMAIC Project
In the Measure and Analyze phase of DMAIC, the F-test is used to determine whether the two independent estimates of population variance differ significantly or whether the two samples drawn from the normal population have the same variance.
Using an F-Test in Hypothesis Testing
A tailed hypothesis is an assumption about a population parameter. The assumption may or may not be true. A one-tailed hypothesis tests the hypothesis where the area of rejection is only in one direction. Whereas two-tailed, the area of rejection is in two directions. The selection of one or two-tailed tests depends upon the problem.
In the F-sampling distribution, F is calculated by dividing the variance of one sample by the other sample’s variance.
For the right-tailed and two-tailed tests, keep the highest variance as the numerator and the lowest variance as the denominator. So, the numerator’s degree of freedom is the degree of freedom for the sample with the highest variance. The degree of freedom for the denominator is the degree of freedom for the sample with the lowest variance.

Meanwhile, for the left-tailed test, keep the lowest variance as the numerator and the highest variance as the denominator. So, the numerator’s degree of freedom is the degree of freedom for the sample with the lowest variance. The degree of freedom for the denominator is the degree of freedom for the sample with the highest variance.

Using an F-Test in Hypothesis testing: Right-tailed test
Example: A botanical research team wants to study the growth of plants using urea. The team conducted eight tests with a variance of 600 during the initial state, and after six months, six tests were conducted with a variance of 400. The experiment aims to know if there is any improvement in plant growth after six months at a 95% confidence level.
- Degrees of freedom ϑ1 = 8 -1 = 7 (highest variance in the numerator)
- ϑ2 = 6 – 1 = 5
- Statistical hypothesis:
- Null hypothesis H0: σ12≤ σ22
- Alternative hypothesis H1: σ12>σ22
- Since the team wants to see the improvement, it is a one-tail (right) test
- Level of significance α= 0.05
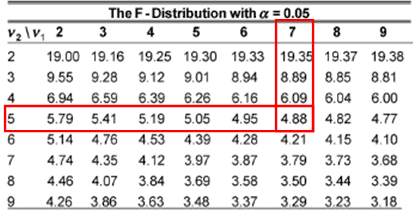
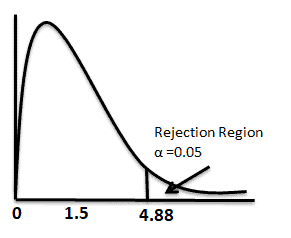
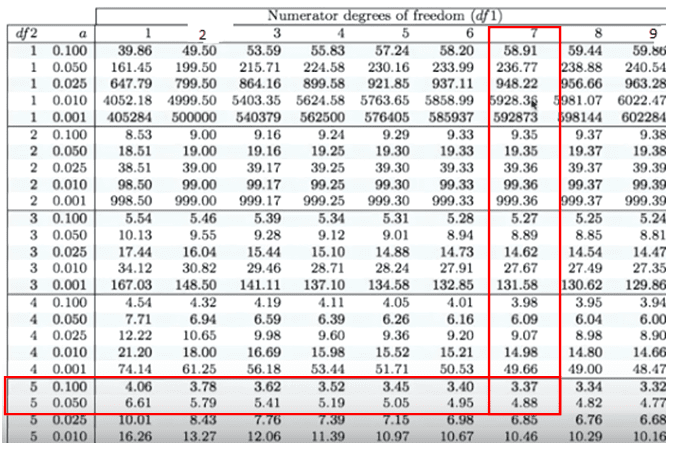
- Compute the critical F from table = 4.88
- Reject the null hypothesis if the calculated F-value is more than or equal to 4.88
- Calculate the F-value F= S12/ S22 =600/400= 1.5
- Fcalc< Fcritical Hence, fail to reject the null hypothesis
p-value
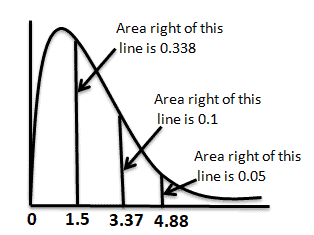
We can find F critical values from the F table that give us a certain area to the right. From the above table, the area to the right of 4.88 is 0.05, and the area to the right of 3.37 is 0.100. So, the area to the right of 1.5 from the graph must be more than 0.100. However, we can easily find the exact p-value using any statistical tool or Excel.
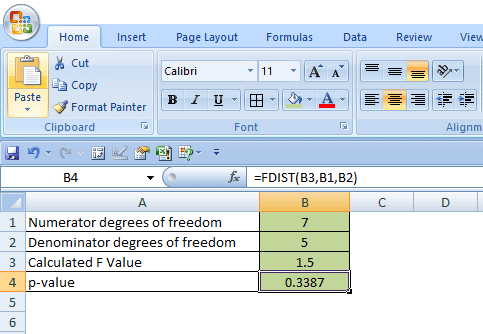
How to calculate p-value in Excel
- Enter numerator degrees of freedom in the B1 cell.
- Then, enter the denominator degrees of freedom value in the B2 cell.
- Enter the calculated F value in the B3 cell.
- Now, p-value = use FDIST function in Excel. In B4 cell type =FDIST(B3, B1, B2), click on enter, and you will get the exact p-value for the right-tailed test.
Interpret the results:
Compare f calc to f critical. In hypothesis testing, a critical value is a point on the test distribution that is compared to the test statistic to determine whether to reject the null hypothesis. Since the f cal value is less than the f critical value, it is not in the rejection region. Hence, we failed to reject the null hypothesis at a 95% confidence level.
F-Test Right-Tailed Excel Template
Using an F-Test in Hypothesis testing: Two-tailed test
A toy manufacturer is planning to place a bulk order for toy batteries. The quality team collected 21 samples from supplier A with a variance of 36 hours and 16 samples from supplier B with a variance of 28. At a 95% confidence level, determine if there is a difference in variance between the two suppliers.
- Degrees of freedom ϑ1 = 21 – 1 = 20 (highest variance in the numerator)
- ϑ2 = 16 – 1 = 15
- Statistical hypothesis:
- Null hypothesis H0: σ12 = σ22
- Alternative hypothesis H1: σ12 ≠ σ22
- Since the team wants to see if there is a difference between the two suppliers, it is a two-tailed test.
- Level of significance α = 0.05.
α/2 = 0.025
- The critical value for the right tail F(0.025,20,15) = 2.7559.
- The critical value for the left tail: Since it is a left tail, we must switch the degrees of freedom and then take a reciprocal of the final answer.
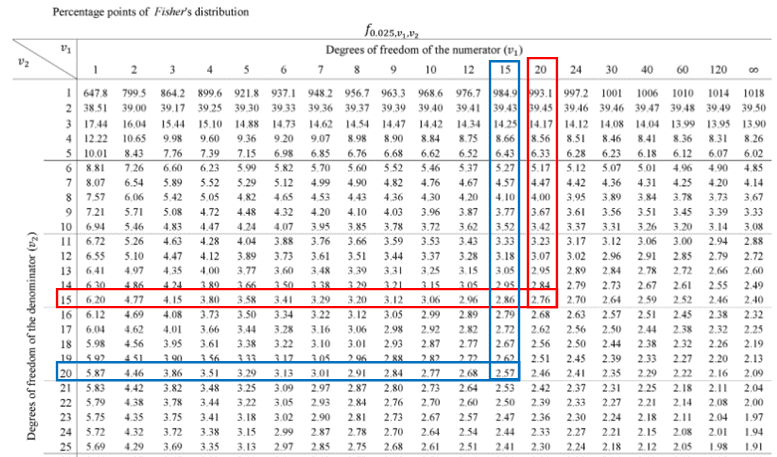
- Reciprocal of F(0.025,15,20) = 1/F(0.025,15,20) = 1/2.57 = 0.389
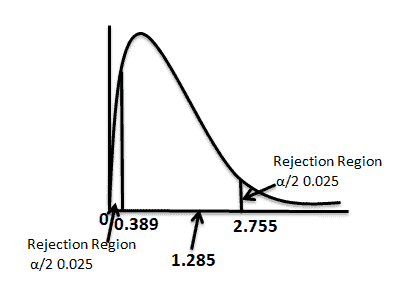
- Calculate the F value F = S12/ S22 = 36/28 = 1.285
Interpret the results:
Compare f calc to f critical. In hypothesis testing, a critical value is a point on the test distribution that is compared to the test statistic to determine whether to reject the null hypothesis. Since the f cal value does lie not lie in the rejection region, we failed to reject the null hypothesis at a 95% confidence level.
F Test Two-Tailed Excel Template
F-Test Sample Questions
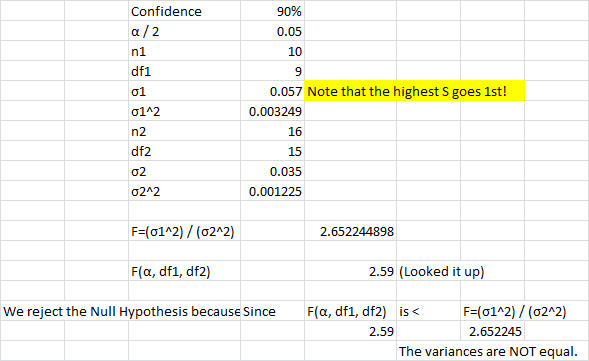
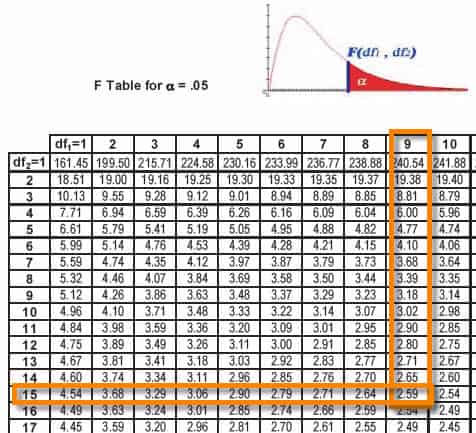
In a manufacturing facility, two Six Sigma Greenbelts monitor the process running the two stamping presses simultaneously. Each press runs the same progressive die. Student A says that he is 90% confident that the stamping presses have the same variance, while student B says the variances are different at the 90% confidence level. Which student is right? Press1: s = 0.035, n = 16 ; Press 2: s = 0.057, n = 10
Left-tailed test
XYZ is an e-commerce site that wants to test if the delivery times in Boston are less than in New York City at a 5% significance level during the Thanksgiving holidays. Twenty-eight delivery times are observed from Boston, with a variance of 38 hours. Twenty-five samples were collected from New York City with a variance of 83 hours.
- Degrees of freedom ϑ1 = 28 – 1 = 27
- ϑ2 = 25 – 1 = 24
- Statistical hypothesis:
- Null hypothesis H0: σ12 ≥ σ22
- Alternative hypothesis H1: σ12 < σ22
- Since the team wants to see if the delivery times in Boston are less than in New York City, it is a left-tailed test.
- Level of significance α= 0.05
- The critical value for the left tail is F(0.95,27,24). Since it is a left tail and we cannot find the 0.95 in the f- f-table, we must switch the degrees of freedom and then take a reciprocal of the final answer.
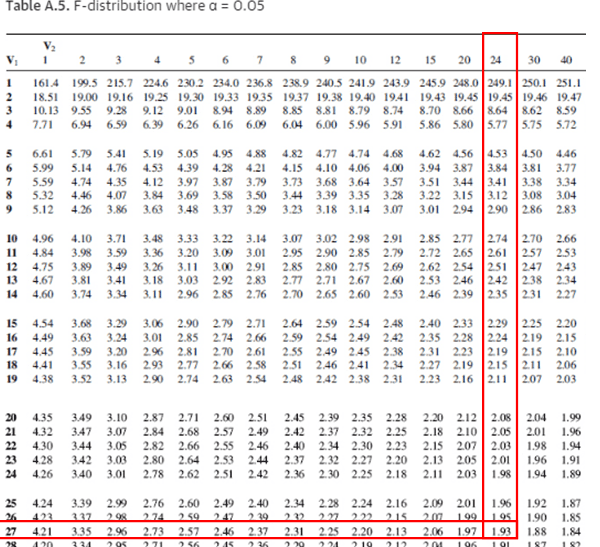
- Reciprocal of F(0.05,24,27) = 1/F(0.025,24,27) = 1/1.93 = 0.5181
- Calculate the F value F = S12/ S22
- For left-tailed test keep the lowest variance as the numerator and the highest variance as the denominator = 38/83 = 0.4578
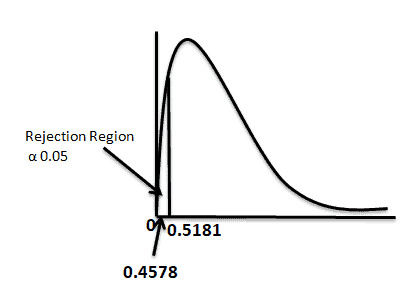
Interpret the results:
Compare f calc to f critical. In hypothesis testing, a critical value is a point on the test distribution that is compared to the test statistic to determine whether to reject the null hypothesis. Since the f cal value is less than the f critical value, and it is in the rejection region. Hence, we reject the null hypothesis at a 95% confidence level.
F Test Left Tailed Excel Template
Helpful Videos
https://www.youtube.com/watch?v=FlIiYdHHpwU
Helpful links
- http://people.richland.edu/james/lecture/m170/ch13-f.html
- https://online.stat.psu.edu/stat500/lesson/7/7.4
When you’re ready, there are a few ways I can help:
First, join 12,000+ other Six Sigma professionals by subscribing to my email newsletter. A short read every Monday to start your work week off correctly. Always free.
* * *
If you’re looking to pass your Six Sigma Green Belt or Black Belt exams, I’d recommend starting with my affordable study guide:
1)→ 🟢Pass Your Six Sigma Green Belt: a study guide organized by the exam Body of Knowledge, 1,000+ practice questions with detailed answer explanations, and 8 full-length mock exams
2)→ ⚫Pass Your Six Sigma Black Belt: the full Black Belt Body of Knowledge, 2,000+ practice questions with detailed answer explanations, and 8 full-length mock exams
You’ve spent so much effort learning Lean Six Sigma. Why leave passing your certification exam up to chance? This comprehensive study guide offers 1,000+ exam-like questions for Green Belts (2,000+ for Black Belts) with full answer walkthroughs, access to instructors, detailed study material, and more.
Thousands have used this system to prepare. Join them here.

Comments (10)
How to find p-value say if my F- Test value is 9.46
Great question! To find the p-value corresponding to an F-test statistic (like 9.46), you’ll also need two more pieces of information:
Once you have those, here’s how you can find the p-value:
Option 1: Use Excel
You can use the Excel formula:
This returns the p-value for a right-tailed F-test.
Option 2: Use an Online F-distribution calculator
Input your F-value, df1, and df2, and it will return the p-value.
Example
If your F-statistic is 9.46, with df1 = 3 and df2 = 20:
This would return a small p-value (indicating statistical significance), likely well below 0.05.
Why It Matters
If your p-value is less than your significance level (usually 0.05), you can reject the null hypothesis, indicating that the variances (or means, depending on context) are significantly different.
To go deeper into F-tests, p-values, and statistical hypothesis testing, these resources will help:
to calculate with the variances … the highest goes first always (in the numerator)?
Yes, when performing an F-test to compare two variances, you should always place the larger variance in the numerator. This ensures that the F-ratio is always greater than or equal to 1, which simplifies interpretation and comparison with the F-distribution table.
Formula:
This convention standardizes the test and ensures that you’re comparing your result to the correct tail of the F-distribution.
How to find p-value if my F-test value is 9.48
To find the p-value from an F-test value of 9.48, you need two key pieces of information in addition to the F-value:
Once you have F = 9.48, df1, and df2, you can find the p-value using one of the following methods:
Option 1: Use Minitab or Statistical Software
Input the F-value and the degrees of freedom to automatically compute the p-value.
Option 2: Use an Online F-distribution Calculator
There are many free tools online where you input F = 9.48, df1, and df2 to get the p-value.
Option 3: Use Excel
Use the Excel formula:
This returns the p-value for a right-tailed F-distribution.
Example:
If df1 = 2 and df2 = 20, then in Excel:
This will yield a p-value of approximately 0.0015, indicating strong evidence against the null hypothesis (assuming alpha = 0.05).
If you provide your degrees of freedom, I can calculate the exact p-value for you.
Additionally, if you’re interested in preparing for your certification, consider our comprehensive courses:
What is meaning of F critical where f calc=1 i.e. (σ1 = σ2 )
please interpret this
Fcalc = 1 implies that the two variances being compared are equal, i.e., σ₁² = σ₂². This is the core idea of the null hypothesis in an F-test for comparing two variances.
What is F-critical?
F-critical is the cutoff value from the F-distribution table that corresponds to a chosen significance level (typically α = 0.05) and the degrees of freedom from each sample (df₁ and df₂). It defines the threshold beyond which we reject the null hypothesis.
Interpretation When Fcalc = 1:
And to develop deeper skills in hypothesis testing and other critical analysis tools, check out:
Opino q este sitio ofrece magníficas explicaciones sobre la distribución F. Y al poner Ejercicios , la información es mejor y más práctica.Muchasbgeaciadvpir haberme dejado suscribir. Me gustaría saber si está prueba ves útil para analizar la diferencia entre mis gastos y mis ingresos
¡Muchas gracias y bienvenida!
I’m glad you found the explanations and exercises helpful.
The F test is generally not used to analyze the difference between your expenses and your income. An F test is primarily used to compare variances or as part of analyses such as ANOVA and regression.
If your goal is to compare average income and expenses over time, other statistical methods are usually more appropriate, depending on your data and what you’re trying to learn. If you can describe your data in more detail, I’d be happy to suggest the best statistical test.