What is a cause-and-effect matrix?
A Cause and Effect Matrix is a Six Sigma tool used to determine the key process input variables (KPIVs) based on priorities of customer outputs (KPOVs). In other words, it reveals perceived strength of influence between process input variables and customer outputs during the root cause analysis, based on team judgement.
The Cause and Effect Matrix aims to prioritize key inputs (Xs) based on how strongly they are believed to influence customer outputs (Ys). This is done using a structured scoring method, but it is not a mathematical or statistical computation of correlation.
Cause and effect analysis, process flow map, and information about the voice of the customer are the prerequisites for a Cause and Effect Matrix.

A cause-and-effect matrix can be used to examine and document relationships between input and output variables. This method is also very similar to the Quality Function Deployment. It provides a structured way to capture the team’s subjective judgments about the importance of each KPIV.
When Would You Use an X-Y Diagram in the DMAIC Process?
The Cause and Effect Matrix is a great tool for prioritizing a long list of possible things and is especially useful in the Measure phase of the DMAIC project. This method is also used to determine the primary factors for experiments in DOE and also to determine the goals of the Matrix Diagram & FMEA.
The input variables might influence the outcome in a process, but not all input variables are equally important. You should use a structured prioritization method to focus on the most important inputs that impact customer outputs, based on team assessments. The Cause and Effect Matrix helps to identify such key inputs.
How Do You Use It?
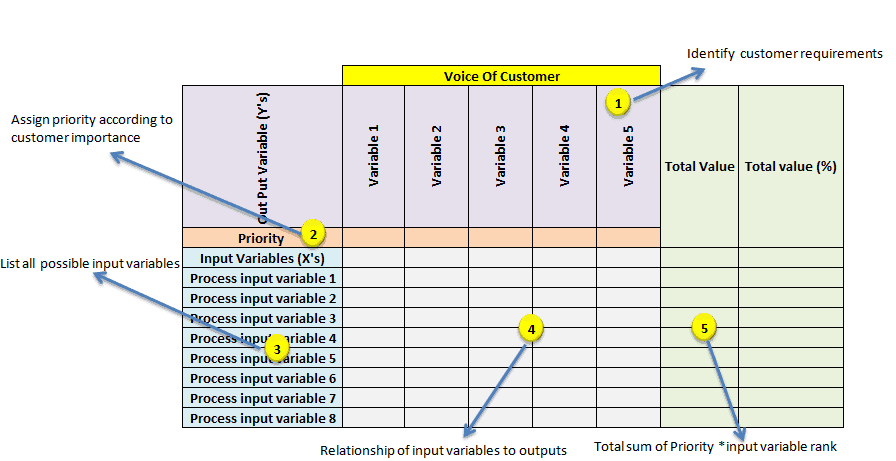
Step 1: First, identify the customer requirements, or in other words, understand the voice of the customer. This can be done by conducting surveys, focus groups, and other means to collect their priorities. Place those priorities at the top of the X-Y diagram.
Step 2: Assign a priority factor for each of the customer outputs. Generally, use a 1-10 scale, with 1 being the low priority and 10 being the high priority to the customer.
Step 3: List all possible key input variables or the improvement factors of the process in each row; those are the Xs in the X-Y diagram
Step 4: Assess the relationship between key input variables and the customer outputs, and then rank each input variable accordingly. We recommend using a geometric progression scale (0,1,3 and 9), with 0 being no impact, 1 – low impact, 3 – medium impact, and 9 – strong impact or strong perceived influence on the output.
Step 5: Cross-multiply the customer output priority numbers with correlation rankings and sum each row at the extreme right column.
Step 6: Finally, determine the rank based on the highest sum total and highlight the critical few variables. This will help to identify the areas for improvement.
An Example of an X-Y Diagram.
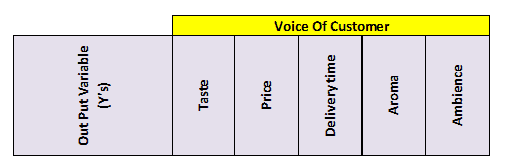
XYZ coffee shop franchise located in the San Diego downtown area has reported falling sales for the past six months. A Six Sigma team conducts a root cause analysis, and they also want to see the key process inputs that are impacting the process.
- Conduct customer surveys and identify key customer requirements.
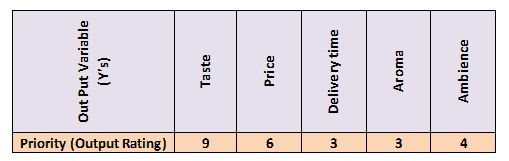
- Assign a priority factor for each of the customer outputs.
- List all possible key input variables.

- Assess the relationship between key input variables and the customer outputs and rank each input variable accordingly.
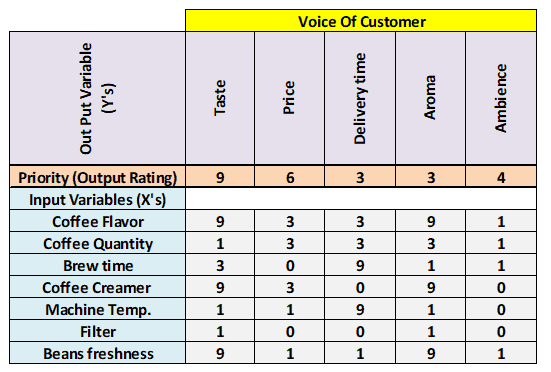
- Cross-multiply the customer output priority numbers with correlation rankings and sum each row.
- Ex: for coffee flavor = 9*9+3*6+3*3+9*3+1*4 = 139
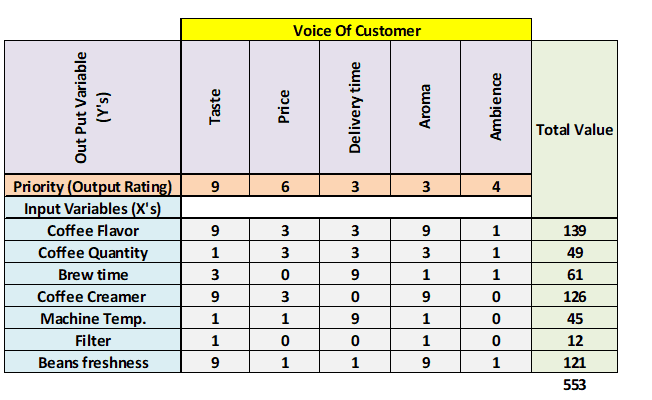
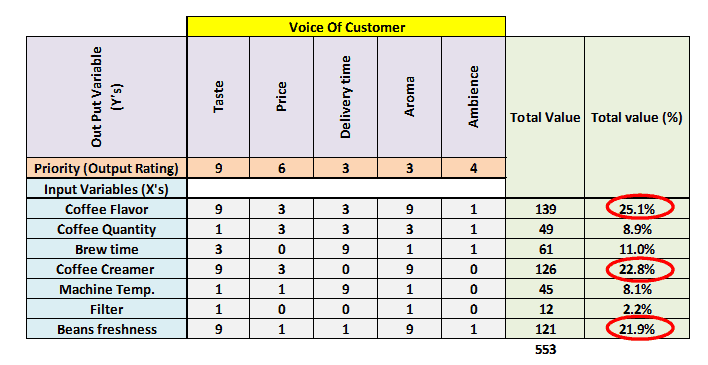
- Finally, determine the rank based on the highest sum total and highlight the critical few variables.
Benefits of Cause and Effect Matrix
- It helps to include customer inputs for decision making.
- Visually depict the prioritized relationships between key input variables and the customer outputs.
- The priority ranking method helps to take the decision based on the score rather than individual opinions.
- Data collection costs may be reduced by ignoring non-key process inputs.
- Helps to list all the input variables required for the process.
Final Note:
The Cause and Effect Matrix is a qualitative tool, not a statistical analysis. The scores represent expert or team judgment about how much influence each input has on customer outcomes. If you need to compute actual correlation, consider tools like regression analysis or DOE (Design of Experiments).
Cause and Effect Matrix Videos
Cause & Effect Matrix Excel Template
When you’re ready, there are a few ways I can help:
First, join 30,000+ other Six Sigma professionals by subscribing to my email newsletter. A short read every Monday to start your work week off correctly. Always free.
—
If you’re looking to pass your Six Sigma Green Belt or Black Belt exams, I’d recommend starting with my affordable study guide:
1)→ 🟢Pass Your Six Sigma Green Belt
2)→ ⚫Pass Your Six Sigma Black Belt
You’ve spent so much effort learning Lean Six Sigma. Why leave passing your certification exam up to chance? This comprehensive study guide offers 1,000+ exam-like questions for Green Belts (2,000+ for Black Belts) with full answer walkthroughs, access to instructors, detailed study material, and more.

Comments (8)
Hi Ted could not find the sixsigma.org website that was in the video. Can you provide the link?
Hi Dan,
I found the link but it looks like the website was abandoned. Worse yet, the website that is now in its place is entirely infested with ID theft software.
So, I won’t post the link, but I can see what I can do about creating a download similar to what they show here. Is that what you were looking for?
Best, Ted.
Hi Ted,
Could you please explain what decision can be made in the Coffee Shop example once you have the ranks?
Are we saying that only the top three will be the focus of the SS project?
Also, what happens when the Xs might not be completely independent? For example, the “beans freshness” affects the “coffee flavour”?
Many thanks.
Hello Varun Pai,
The objective of cause and effect matrix is to mathematically compute the correlation between key process input variables (X’s) and Customer outputs (Y’s).
In a process all the input variables might influence the outcome, but all the input variables are not equally important. Hence develop a mathematical model to concentrate the important input variables with respect to the customers output.
There is no hard and fast rule to take only top 3. Based on customer importance, you can consider top priority Xs. It helps to include customer inputs for decision-making.
Basically, priority ranking method helps to take the decision based on score rather than individual opinions.
If any of the Xs are dependent, you can consider both for the implementation of process improvements or corrective actions.
Thanks
Ramana
Actually you are not computing the correlation between x and y at all. What you are doing is simply assigning a subjective score to the strength of associativity between x and y.
You’re right to point that out — thank you for keeping the discussion accurate and clear.
You’re absolutely correct: the Cause and Effect Matrix does not compute statistical correlation in the technical sense. Instead, it uses subjective or expert-assigned scores to estimate the relative importance or influence of each input (X) on each output (Y). These scores are then weighted by customer priorities to help guide focus.
To avoid confusion, we should clarify that while this tool is quantitative in format, it’s qualitative in nature — it’s a prioritization method, not a statistical analysis.
I’ll update the page and prior responses to make that distinction clearer.
Thank you for the great example of the X-Y diagram!
Glad it was helpful, Barbara!