

Value Stream Analysis (VSA) is the step that comes after Value Stream Mapping. It’s the critical examination of a value stream map to find and prioritize opportunities for improvement. Mapping documents how work actually flows today. Analysis is where you interrogate that map for waste, delay, and misalignment between supply and demand, then turn what you find into specific, assignable improvements.
Value Stream Analysis vs. Value Stream Mapping
Value Stream Mapping is the act of building the picture. You walk the process, document each step, and capture metrics like cycle time, lead time, and percent complete and accurate. Value Stream Analysis is what you do with that picture once it exists. You’re no longer drawing boxes and arrows. Instead, you’re asking why each step takes as long as it does, where the process is fighting itself, and which fixes would actually move the total lead time. A value stream map without analysis is just documentation. Analysis is what turns it into an improvement plan.
What Value Stream Analysis Looks For
During value stream analysis, teams work through the map looking for specific, recurring categories of problems:
- Bottlenecks and areas of slow flow: the step (or steps) with the longest cycle time relative to the others, since that’s what paces the whole process regardless of how fast everything else runs.
- Excessive wait times, queues, and delays: the gap between a step’s cycle time and its lead time. A large gap means work is sitting idle between steps, which is usually a bigger opportunity than the steps themselves.
- Unnecessary steps in the process: work that doesn’t add value from the customer’s perspective and could be removed rather than optimized.
- The balance between supply and demand: whether upstream supply (materials, staffing, capacity) is actually matched to what downstream demand requires, or whether the process is chronically over- or under-supplied.
- The overall value delivered to the customer: stepping back from individual steps to ask whether the end-to-end process is actually giving the customer what they need, as fast as they need it.
How to Conduct a Value Stream Analysis
- Start from a validated current-state map. Bring back the same team that helped build it, since they know where the numbers came from and where the map is simplifying reality.
- Walk each process step against the five lenses above. Don’t just flag that a step “feels slow.” Tie every finding to bottleneck, wait time, unnecessary work, supply/demand mismatch, or value delivered, so it’s clear what kind of problem you’re solving.
- Quantify the impact using the map’s own data. The cycle time, lead time, and %C&A figures already on the map let you rank findings by actual size instead of by whichever problem is most visible or most recently complained about.
- Turn each finding into a Kaizen. A Kaizen is a specific, assignable improvement idea, not a general observation. Mark it directly on the map at the step it affects.
- Prioritize the Kaizens and build the future-state map. Weigh impact against effort, then draw what the process should look like once the highest-priority improvements are in place.
- Track the result against the current-state baseline. Once improvements are implemented, remeasure cycle time and lead time and compare them to where you started, the same way you would close out any DMAIC project.
Worked Example: Analyzing the Battery Manufacturing Value Stream
Continuing the battery manufacturing example from the Value Stream Mapping guide: XYZ’s current-state map showed a total cycle time of 53 hours against a total lead time of 85 hours, with the biggest wait-time gaps sitting between plates curing/drying and battery assembly. Analyzing that map, the team identified three Kaizens to close the gap between cycle time and lead time:
- Avoid unnecessary transportation of plates between the curing and assembly stations.
- Reduce the defect rate coming out of battery assembly.
- Increase welding machine uptime at the battery charging step.
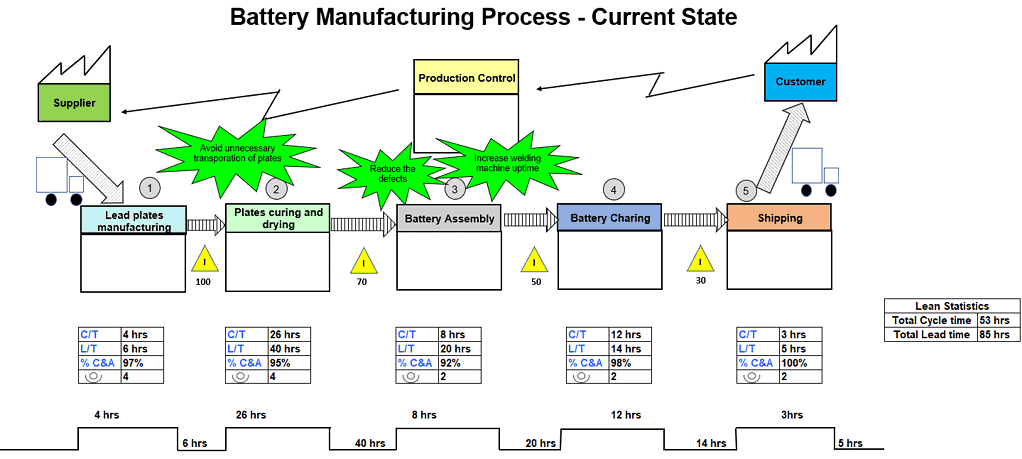
From here, the team builds a future-state map based on those Kaizen improvements:
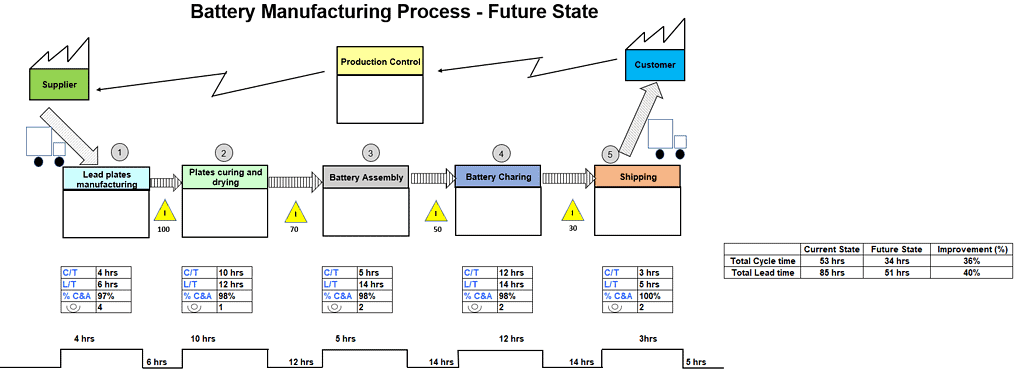
That side-by-side comparison (current state versus future state versus percent improvement) is the actual output of a value stream analysis. The map alone only describes the process; the analysis is what turns it into a documented, measured improvement.
Related Topics
- Value Stream Mapping: how to build the current-state map that analysis starts from.
- Kaizen: turning analysis findings into specific improvement actions.
- Classic Wastes: the categories of waste value stream analysis is usually looking for.
- Analyze Phase (DMAIC): where value stream analysis typically fits in a broader Six Sigma project.