Lean Six Sigma in Action: Tackling the New Year’s Gym Rush with DMAIC
Happy New Year, everyone!
This year, I will be publishing one fictional Six Sigma Case study every month. Here’s the first installment.
My goal is to help make Lean and Six Sigma topics and concepts ‘real’ by showing how companies could apply them in various ways. If there’s a topic you struggle with seeing how it could be used, or if you have a request for a particular industry, please let me know, and I’ll see about featuring it.
Now, on to the Case Study.
New Year, New Six Sigma Case Study
Every January, gyms prepare for the inevitable crush of new members, eager to fulfill their fitness resolutions. At one flagship gym, the result was predictable: overcrowding, long waits for equipment, and frustrated members canceling their memberships.
How would it look if this year, in our fictional gym, we tackled the chaos head-on using Lean Six Sigma?
Define: Understanding the Problem
The first step in any Six Sigma project is to define the problem and set achievable goals. You would typically do this with a Project Charter. Here’s a somewhat abbreviated version.
Problem Statement
At the start of every year, gyms experience a surge in membership due to New Year’s resolutions. While this influx is excellent for sign-ups, it often leads to member dissatisfaction caused by long wait times for equipment during peak hours. Overcrowding and unavailable machines drive members to cancel their memberships, resulting in high churn rates by February – and lower potential profits for the gym!
Project Goals
- Primary Goal: Reduce customer wait times for machines during peak hours (6–8 AM and 5–7 PM) by 40%.
- Secondary Goal: Decrease member churn rates by 20% by the end of Q1.
Scope and Constraints
- Scope:
- Focus on machine availability and wait times during the critical early-year surge (January and February).
- Target one flagship gym location as a pilot.
- Constraints:
- The budget for interventions is limited to $10,000.
- Solutions must be scalable to other locations in the future.
Voice of the Customer (VOC)
Understanding the Voice of the Customer (VOC) ensures that improvement efforts align with what matters most to members, driving solutions that directly address their pain points.
Key feedback from member surveys and complaints:
- “The wait for machines during peak times is unbearable.”
- “I feel like I spend more time waiting than working out.”
- “I joined for convenience, but I’m thinking of canceling because it’s too crowded.”
Team and Stakeholders
- Team Roles:
- Gym Manager: Project leader overseeing implementation.
- Operations Team: Responsible for equipment maintenance and availability.
- Marketing Team: Develop member retention strategies.
- Six Sigma Black Belt: Provides guidance on process improvements and data analysis.
- Stakeholders:
- Members: Both current and at risk of canceling.
- Gym Ownership: Concerned with revenue impact from churn.
- Trainers: Clients require access to functional equipment.
Project Charter Summary
This project aims to reduce member churn by addressing long wait times for equipment, particularly during peak hours. By improving machine availability and enhancing the overall gym experience, we aim to retain members, improve satisfaction, and set the stage for sustainable growth.
Measure: Quantifying the Problem
With the problem defined, we moved to measure its impact. Surprisingly, machine breakdowns emerged as a key contributor to machine wait time. By analyzing maintenance logs and conducting staff interviews, we gathered valuable data:
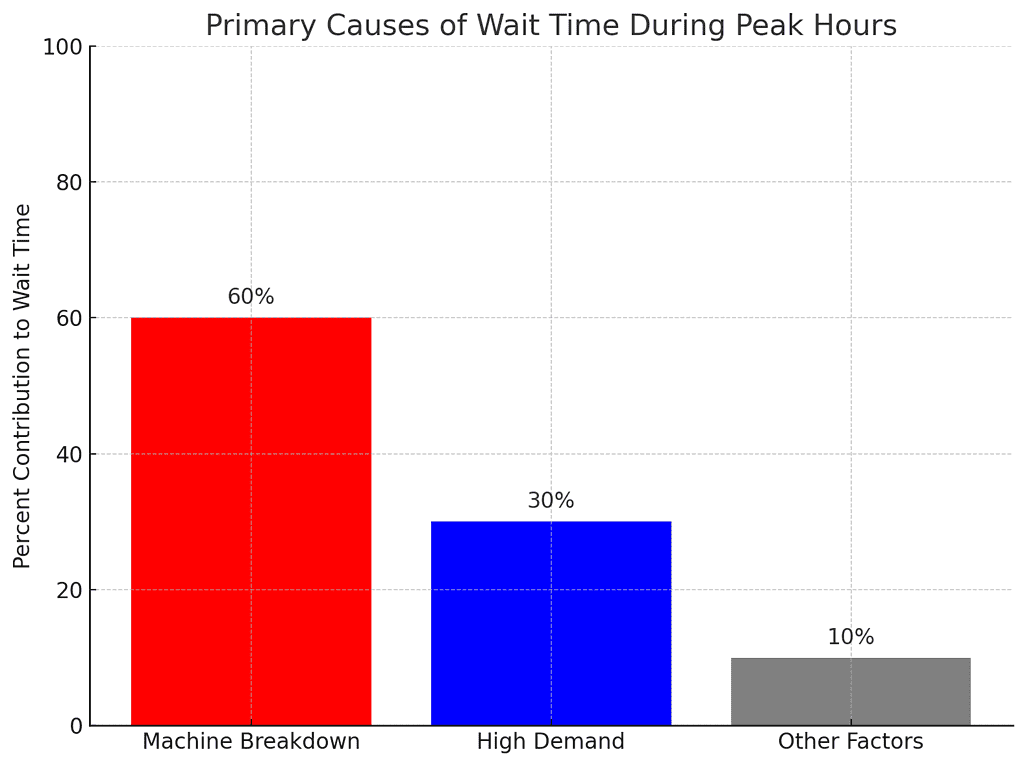
Here is a bar chart illustrating the primary causes of wait time during peak hours:
- Machine Breakdown: Contributes 60% to wait times, making it the dominant factor.
- High Demand: Accounts for 30%, reflecting a secondary but less critical cause.
- Other Factors: Contribute just 10%, indicating minimal impact.
This visualization reinforces the importance of targeting machine breakdowns as the program’s key focus to reduce wait times effectively.
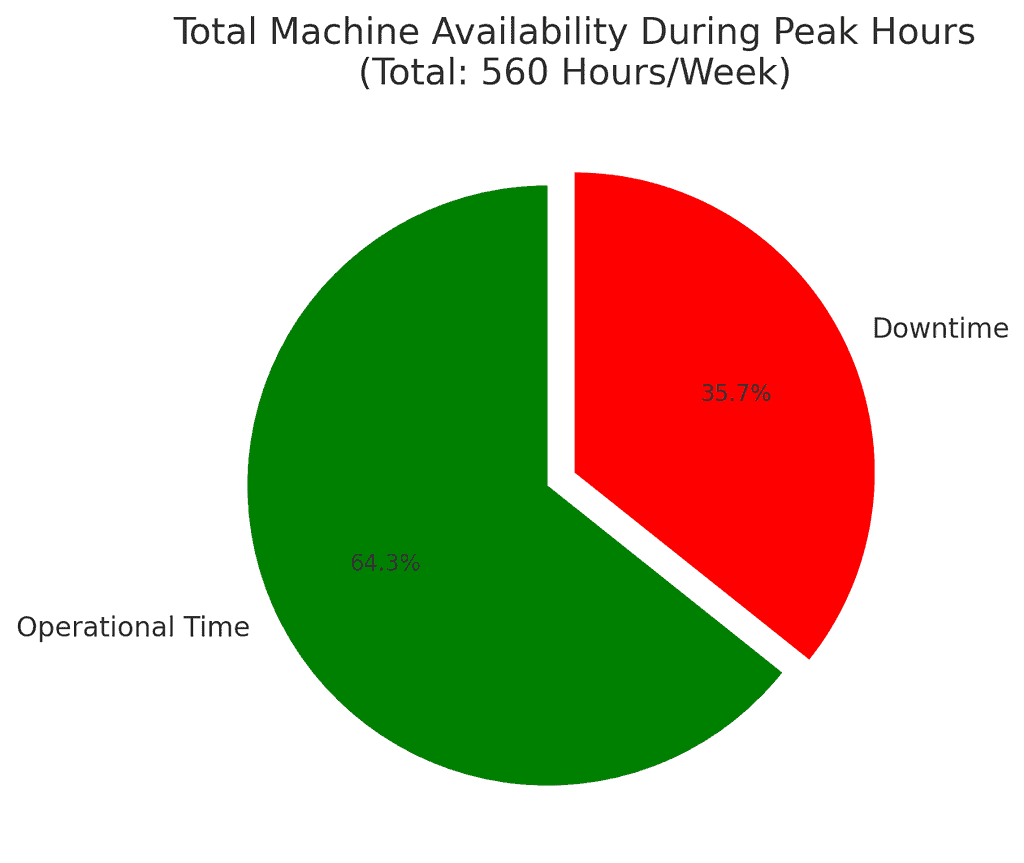
Machines experienced 200 hours of downtime per week during peak hours!
Total Peak Time per Week:
- 20 machines × 28 hours of peak time = 560 hours/week.
Breakdown:
- Operational Time: Machines are operational for 360 hours/week (64.3%).
- Downtime: Machines experience 200 hours/week of downtime (35.7%).
Let’s dive in further and see what else we can learn.
Analyze: Identifying the Root Causes
Pareto Analysis: Key Contributors to Downtime
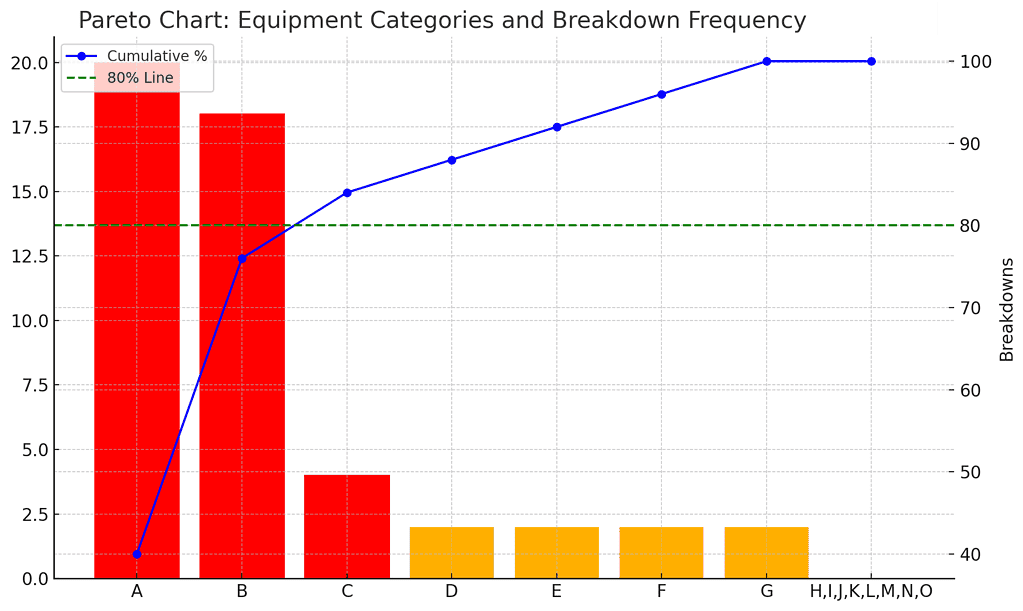
A small subset of machines (20%) accounted for 80% of all maintenance incidents—classic Pareto principle. We conducted a Pareto analysis to identify the primary contributors to machine breakdowns. The results showed that 80% of breakdowns occurred with machines from the top three vendors (A, B, and C). These vendors supply high-usage machines (e.g., cycles and elliptical machines), highlighting the need to prioritize equipment from these suppliers for improvement efforts.
Key Insight: Targeting machines from these vendors can have the most significant impact on reducing overall downtime.
This data gave us a clear baseline and a direction for further analysis.
Regression Analysis: Relationship Between Downtime and Wait Times
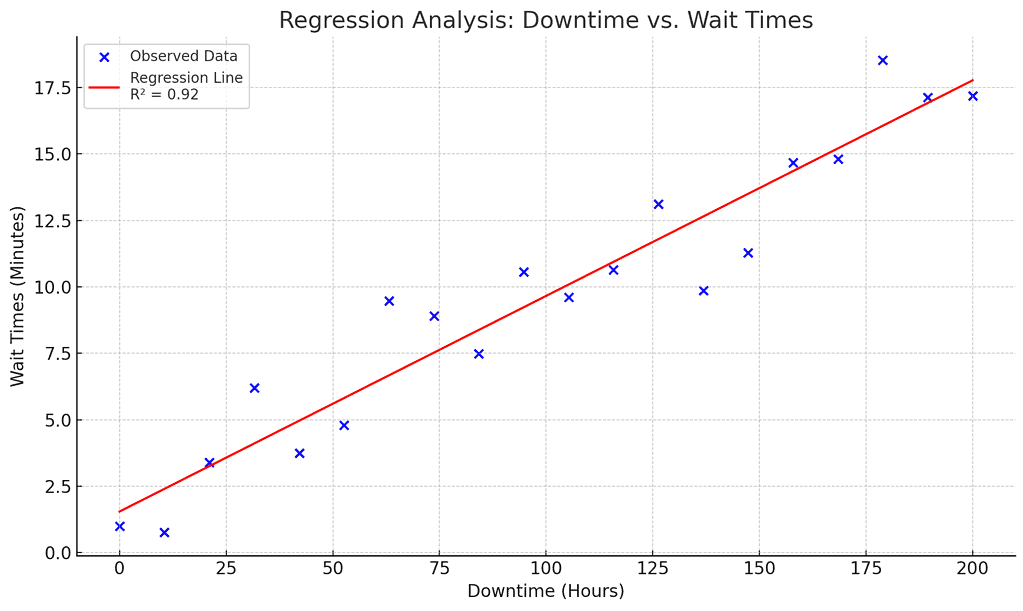
We examined the relationship between cumulative machine downtime and average wait times reported by members during peak hours.
- Data Setup:
- Total Peak Time: 560 hours/week for all 20 machines.
- Operational Time: 360 hours/week (64.3%).
- Downtime: 200 hours/week (35.7%).
- Regression Results:
- We used regression analysis to find a strong positive correlation (R² = 0.85) between total downtime and member-reported wait times.
- Each hour of downtime contributed to a proportional increase in average wait time, particularly during critical peak periods.
Visual:
The scatterplot above shows the observed relationship between downtime (hours) and wait times (minutes) during peak hours:
- Blue points: Observed data of downtime and member-reported wait times.
- Red line: Regression line representing the predicted relationship with an R2=0.92R^2 = 0.92R2=0.92, indicating a very strong correlation.
Regression Details:
- Slope (Change in Wait Time per Downtime Hour): 0.081 minutes/hour
- The average wait time increases by approximately 0.08 minutes for every additional hour of machine downtime.
- Intercept (Baseline Wait Time): 1.55 minutes
- The baseline wait time, assuming zero downtime is approximately 1.55 minutes.
- R2R^2R2 (Correlation Strength): 0.92
- Indicates that 92% of the variability in wait times can be explained by downtime.
- P-value (Statistical Significance): 3.49×10−113.49 \times 10^{-11}3.49×10⁻¹¹
- This very low p-value confirms the relationship is statistically significant.
- Standard Error: 0.0057
- Measures the accuracy of the slope estimate, showing a low error margin.
This analysis demonstrates that downtime is a primary driver of wait times, reinforcing the importance of reducing breakdowns.
Key Insight: Reducing machine downtime has a direct and measurable impact on decreasing wait times, emphasizing the importance of improving equipment reliability and availability.
Improve: Piloting the Solutions
1. Chi-Square Hypothesis Test in Pilot Plan
The chi-square test will be moved to the Improve Phase as part of a pilot program.
- Pilot 1: Rotate Vendor D’s equipment (superior reliability) to high-volume spots where Vendors A, B, and C were previously positioned.
- Hypothesis Test Setup:
- Null Hypothesis (H₀): Vendor A’s equipment failure rates are not significantly different from Vendor D’s.
- Test Focus: Compare breakdown rates of Vendor A and Vendor D during the pilot phase to validate the superiority of Vendor D’s equipment.
Chi-Square Test Visualization (Pilot 1: Vendor A vs. Vendor D)
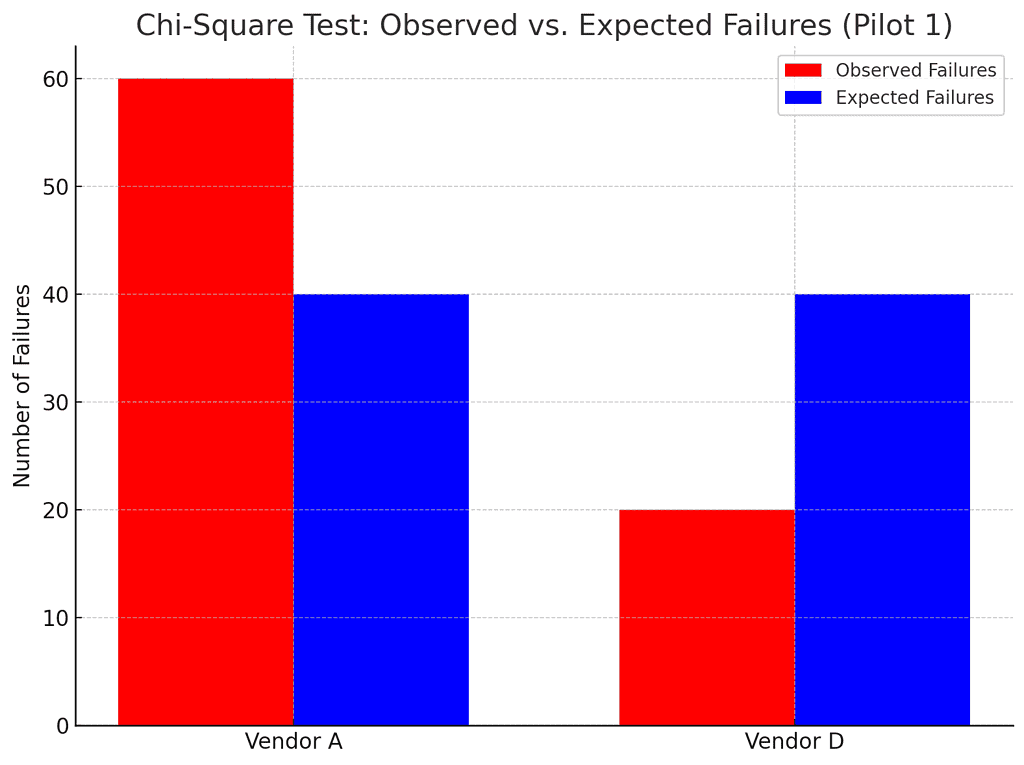
The bar chart compares the observed failures (Vendor A: 60, Vendor D: 20) to the expected failures (Vendor A: 40, Vendor D: 40) under the null hypothesis of equal reliability:
- Chi-Square Statistic: 9.63
- P-Value: 0.0019 (statistically significant).
- Conclusion: Vendor D’s equipment significantly outperformed Vendor A’s during the pilot.
2. Second Pilot Plan: Vendor Transition
Even though DMAIC is portrayed as a linear progression, sometimes repeating earlier phases to deliver the best result iteratively becomes necessary. That’s what we are doing here. We are taking what we learned from the first pilot plan and putting it to the test before declaring success.
- Pilot 2: Replace Vendor A’s equipment with Vendor B’s at high-traffic spots based on earlier downtime findings.
- Expected Outcome: Measure reduced downtime and improved wait times post-rotation.
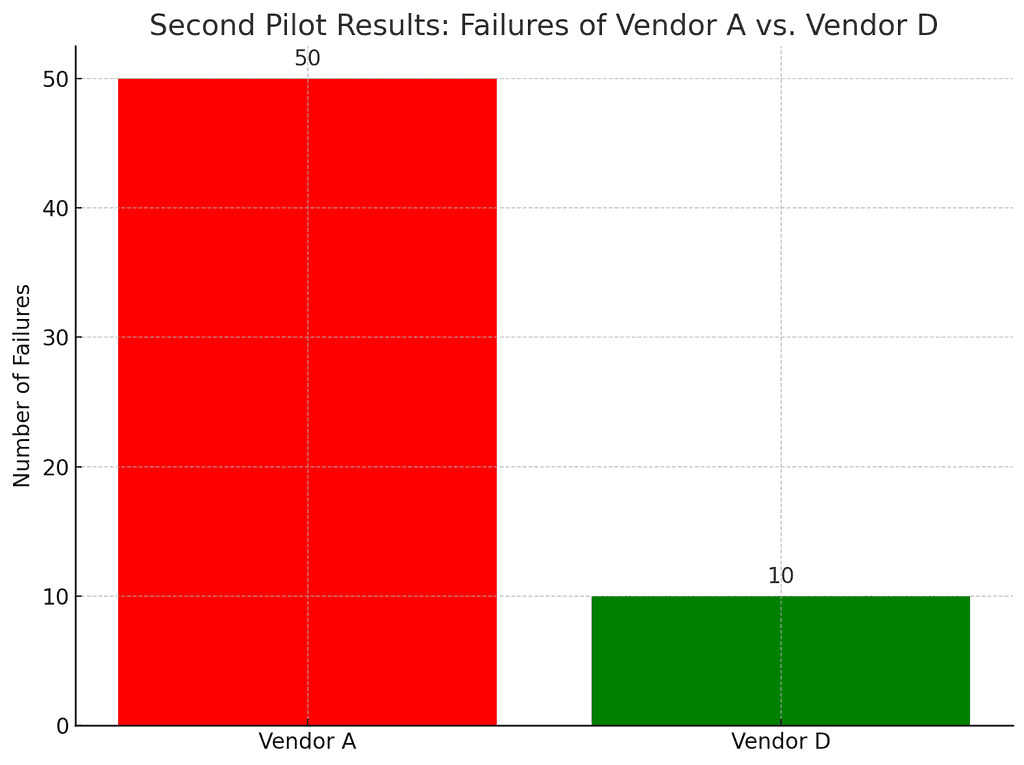
The second chart highlights post-pilot failures for each vendor:
- Vendor A: 50 failures.
- Vendor D: 10 failures.
This visual clearly shows Vendor D’s superior reliability, with fewer breakdowns than Vendor A.
Control: Sustaining the Gains
To ensure these improvements lasted, we developed a robust control plan:
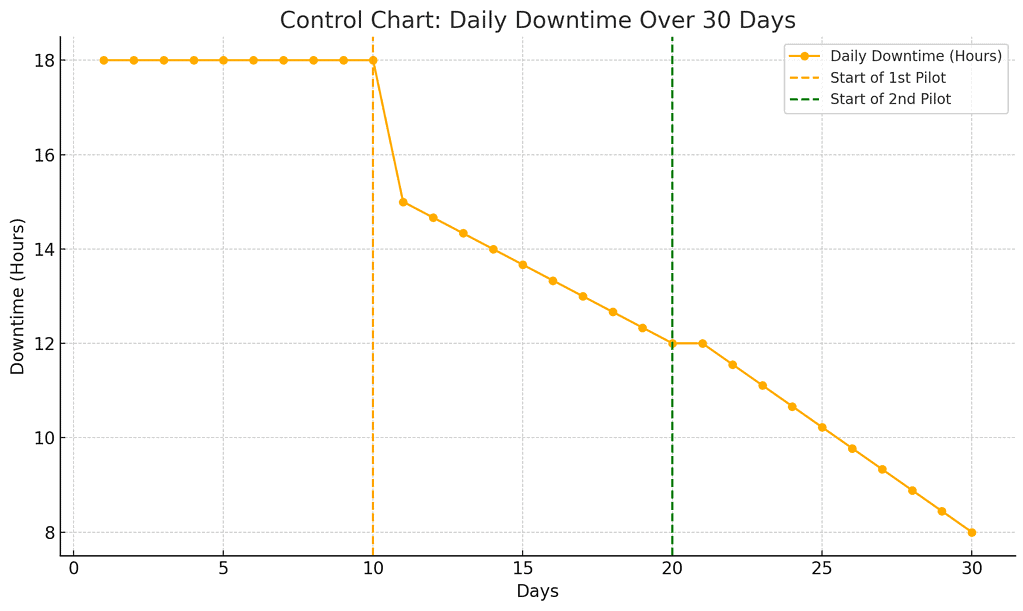
- Daily Downtime Control Chart
- First 10 Days (Original Downtime): Machines experienced consistent downtime of 18 hours/day.
- Days 11–20 (First Pilot): Downtime began to decrease, stabilizing at 12 hours/day by the end of the pilot.
- Days 21–30 (Second Pilot): Downtime was further reduced, stabilizing at 8 hours/day.
- Daily Member Churn Control Chart
- First 10 Days (Original Churn): Member churn was consistently high at 20 members/day.
- Days 11–20 (First Pilot): Churn started to decline, reaching 15 members/day by the end of the first pilot.
- Days 21–30 (Second Pilot): Churn improved further, stabilizing at 10 members/day.
Control Phase: Sustaining Improvements
1. Downtime Control Plan
- Routine Monitoring: IoT sensors track machine usage, and flag maintenance needs in real-time.
- Preventive Maintenance Schedule: Standardize weekly maintenance for high-risk machines (Cycles, Ellipticals).
- Vendor Selection Protocols: Prioritize vendors with proven reliability (e.g., Vendor D).
2. Member Retention Plan
- Continuous Feedback: Conduct quarterly surveys to track member satisfaction and identify new issues.
- Operational Dashboards: Monitor key metrics like downtime and churn to identify anomalies early.
- Incentive Programs: Offer loyalty rewards or discounts to retain members during peak periods.
At the heart of this case study was the challenge of reducing gym member churn during the peak New Year’s resolution season. By leveraging Lean Six Sigma tools and methodologies, the project focused on improving machine availability, which was identified as the primary driver of long wait times and dissatisfaction.
These measures ensure that the improvements achieved during the pilots are sustained and scalable across our hypothetical gym locations!
This hypothetical project achieved its goals and demonstrated the power of data-driven decision-making. By targeting machine reliability, the gym significantly enhanced member satisfaction, improved retention, and set a scalable framework for sustained operational success.
Ready to Solve Your Challenges?
Whether you’re managing machines or people, Six Sigma offers powerful tools to optimize operations and delight customers. Let this gym’s success inspire your next project.
We’d love to hear your thoughts. Have you faced similar challenges at work?
Best, Ted
When you’re ready, there are a few ways I can help:
First, join 30,000+ other Six Sigma professionals by subscribing to my email newsletter. A short read every Monday to start your work week off correctly. Always free.
—
If you’re looking to pass your Six Sigma Green Belt or Black Belt exams, I’d recommend starting with my affordable study guide:
1)→ 🟢Pass Your Six Sigma Green Belt
2)→ ⚫Pass Your Six Sigma Black Belt
You’ve spent so much effort learning Lean Six Sigma. Why leave passing your certification exam up to chance? This comprehensive study guide offers 1,000+ exam-like questions for Green Belts (2,000+ for Black Belts) with full answer walkthroughs, access to instructors, detailed study material, and more.

