Standard deviation is used to measure the amount of variation in a process. This is one of the most common measures of variability in a data set or population.
There are 2 types of equations: Sample and Population.
What is the difference between Population and Sample?
Population refers to ALL of a set, and the sample is a subset. We most often have a sample and are trying to infer something about the whole group. However, if we want to know a truth of a subset of a whole population, use the Population equation.
Use Population When:
- You have the entire population.
- You have a larger population sample, but you are only interested in this sample and do not wish to generalize your findings to the population.
Use Sample When (Most often):
- If all you have is a sample but wish to make a statement about the population standard deviation from which the sample is drawn, you need to use the sample SD.
Remember: It is impossible to have a negative standard deviation.
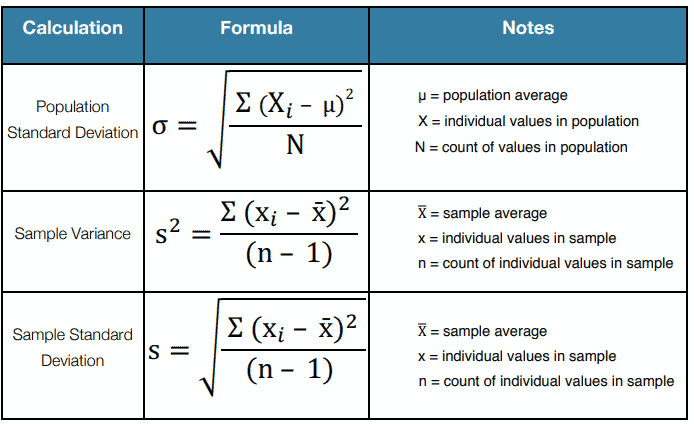
How to Measure the Standard Deviation for a Sample (s)
Standard Deviation for a Sample (s)
- Calculate the mean of the data set (x-bar)
- Subtract the mean from each value in the data set
- Square the differences found in step 2.
- Add up the squared differences found in step 3.
- Divide the total from step 4 by (n – 1) for sample data
- (Note: At this point, you have the variance of the data).
- Take the square root of the result from step 5 to get the SD
Example of Standard Deviation for a Sample (s)
The length of 8 bars in centimeters is 9, 12, 13, 11, 12, 8, 10, and 11. Calculate the sample standard deviation of the length of the bar.
- Calculate the mean of the data set
(9+12+13+11+12+8+10+11)/8=86/8=10.75
2. Subtract the mean from each value in the data set
- 10.75-9=1.75
- 10.75-12=-1.25
- 10.75-13=-2.25
- 10.75-11=-0.25
- 10.75-12=-1.25
- 10.75-8=2.75
- 10.75-10=0.75
- 10.75-11=-0.25
3. Square the differences found in step 2.
- (1.75)2 =3.06
- (-1.25)2 =1.56
- (-2.25)2 =5.06
- (-0.25)2 =0.06
- (-1.25)2 =1.56
- (2.75)2 =7.56
- (0.75)2 =0.56
- (-0.25)2 =0.06
4. Add up the squared differences found in step 3 =19.50
5. Divide the total from step 4 by (n – 1) for sample data=19.5/8-1=2.79, so the variance is 2.79
6. Take the square root of the result from step 5, SD of sample bar length = 1.67
How to Measure the Standard Deviation for a Population (σ)
Standard Deviation for a Population (σ)
- Calculate the mean of the data set (μ)
- Subtract the mean from each value in the data set
- Square the differences found in step 2.
- Add up the squared differences found in step 3.
- Divide the total from step 4 by N (for population data).
- (Note: At this point, you have the variance of the data).
- Take the square root of the result from step 5 to get the SD
Example of Standard Deviation for a Population (σ)
Nana’s Bakery wants to optimize the consistency of its cakes. The recipe calls for a certain number of eggs. The problem is that there is variation in egg sizes. Six eggs were randomly selected, and the following weights were recorded (measured in ounces).
2.25; 1.75; 2.0; 2.5; 2.3; 1.8
What is the SD of the egg weights?
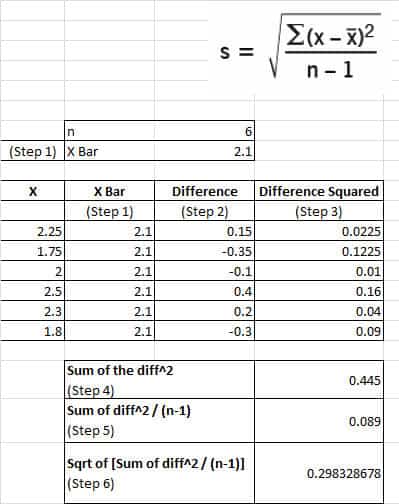
Standard Deviation and Variance
Variance is Std Dev ^2.
Std Dev = Sqrt(variance)
The Uniform Distribution
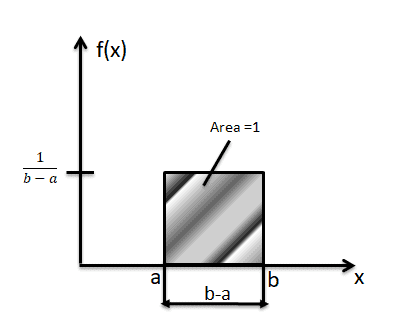
A uniform distribution is a continuous probability distribution. It describes the condition where all possible outcomes of a random experiment are equally likely to occur. For the uniform distribution, the probability density function f(x) is constant over the possible values of x.
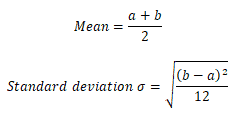
The formula for Mean and standard deviation of uniform distribution
Probability density function

The Area between p and q

Area right of x

Area left of x

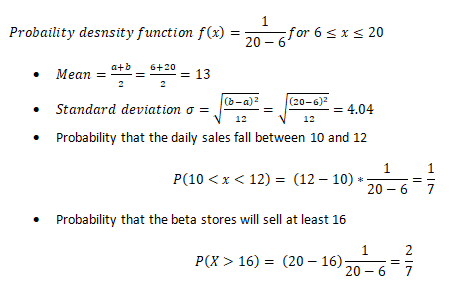
Example: The number of mobile phones sold by Beta stores is uniformly distributed between 6 and 20 per day. Then find
- Mean
- Standard deviation
- Probability that the daily sales fall between 10 and 12
- Probability that the Beta stores will sell at least 16
Let X be the number of mobiles sold daily by beta stores: X follows the uniform distribution over (6, 20). Thus the probability density function is:
Standard Deviation of Sample Proportion – Quality Control Example
Walkthrough: Standard Deviation of a Sample Proportion
Question: In a factory, 5% of manufactured bolts are known to be defective. A quality inspector randomly samples 400 bolts. What is the standard deviation of the sample proportion of defective bolts, assuming the distribution is approximately normal?
Step 1: Identify the known values
- Population proportion (
p) = 0.05 - Sample size (
n) = 400
Step 2: Use the standard deviation formula for a sample proportion
σp̂ = √[ p(1 − p) / n ]
Step 3: Plug in the values
σp̂ = √[ 0.05 × (1 − 0.05) / 400 ]
= √[ 0.05 × 0.95 / 400 ]
= √[ 0.0475 / 400 ]
= √0.00011875
Step 4: Calculate
√0.00011875 ≈ 0.0109
Final Answer:
The standard deviation of the sample proportion of defective bolts is approximately 0.0109.
Helpful Videos
Video on Variance
The Normal Curve
The Uniform Distribution
When you’re ready, there are a few ways I can help:
First, join 30,000+ other Six Sigma professionals by subscribing to my email newsletter. A short read every Monday to start your work week off correctly. Always free.
—
If you’re looking to pass your Six Sigma Green Belt or Black Belt exams, I’d recommend starting with my affordable study guide:
1)→ 🟢Pass Your Six Sigma Green Belt
2)→ ⚫Pass Your Six Sigma Black Belt
You’ve spent so much effort learning Lean Six Sigma. Why leave passing your certification exam up to chance? This comprehensive study guide offers 1,000+ exam-like questions for Green Belts (2,000+ for Black Belts) with full answer walkthroughs, access to instructors, detailed study material, and more.


Comments (24)
Thanks a lot!
Very welcome, Roberto.
I really appreciate your explanations.
You’re welcome, Sonia. Happy to help!
How is this related to Six Sigma where we are expected to see a 99.9996 ?
Sashi, the sigma in Six Sigma refers to standard deviation. Six Sigma refers to what percentage is under the curve at six sigmas – or standard deviations from center. Does that help?
I am understanding now. thanks
Glad to hear it, Sharon!
Please advise vsf targets and minimum vs maximum Range and if no maximum Range do we have ranking for ex..
1 to 2 is controlled
3 to 4 is out of control
4 to 5 is above cout of control
I’m not sure what you mean here, Nessma. Can you elaborate?
When you mention “vsf targets,” could you clarify what “vsf” stands for in your context? Are you referring to specification limits, standard deviation ranges, or something else?
It sounds like you’re trying to understand how to interpret a process’s variation. Maybe you’re trying to classify in terms of ranges or control limits? And maybe you’re asking how to categorize whether it’s “controlled” or “out of control.”
If that’s the case, I’d be happy to walk through how Six Sigma uses control charts and capability indices (like Cp, Cpk) to classify process behavior.
Feel free to share an example or clarify what kind of process or data you’re looking at. Happy to help further!
When d2 changes the cp and cpk values are varrying. If so what will be the spec for each subgroup size.
You’re absolutely right. The d₂ constant varies with subgroup size, and this variation directly impacts the estimated standard deviation. That in turn affects Cp and Cpk values. Understanding this relationship is crucial for accurate process capability analysis.
📏 Why d₂ Matters in Cp and Cpk Calculations
In Six Sigma and Statistical Process Control (SPC), when estimating the process standard deviation (σ) from sample data, the formula used is:
Here:
As the subgroup size increases, the d₂ value also increases. This means that for the same average range, a larger d₂ (from a larger subgroup size) will result in a smaller estimated standard deviation. Consequently, Cp and Cpk values will be higher, indicating a more capable process.
📊 d₂ Values for Common Subgroup Sizes
Below is a table of d₂ values for various subgroup sizes:
These values are sourced from standard control chart constant tables. For a comprehensive list, refer to the MIT Control Chart Constants.
What does that mean for Process Capability?
Since Cp and Cpk are calculated using the estimated standard deviation, any change in d₂ due to a different subgroup size will affect these capability indices. Specifically:
Best to maintain a consistent subgroup size when comparing Cp and Cpk values over time or between processes.
Best Practices
To ensure accurate and meaningful Cp and Cpk calculations:
If you’re preparing for Six Sigma certification and want to ensure you grasp these concepts thoroughly, consider enrolling in our comprehensive courses:
i have a question
Let’s assume that based on a customer survey, the weight of a product is approved at the best acceptable level of 120 grams +- 12 grams . standard deviation of each product labled .If the standard deviation of a product is 6, what is the level of the sigma? If it is the 10 what the sigma level
Hello Alireza,
Actually we need process mean to compute sigma value.
Cpk is a measure to show how many standard deviations the specification limits are from the center of the process.
Process sigma = 3* Cpk.
LSL = 108
USL= 132
SD=6 or 10
Process mean= ??
• Cplower = (Process Mean – LSL)/(3*Standard Deviation)
• Cpupper = (USL – Process Mean)/(3*Standard Deviation)
• Cpk is smallest value of the Cpl or Cpu: Cpk= Min (Cpl, Cpu)
You can refer more about process sigma at https://sixsigmastudyguide.com/project-baseline-sigma/
Thanks
Estimation of standard deviation depends on what
Specification limits
Target/Nominal value
Observed data
None of the above
This is a neat question, Arun.
To answer I recommend looking at each of the options you listed and asking what each has to do with Standard Deviation, if anything.
What are your thoughts?
Thanks Ted for the well-written guide.
In all of my studies, I still struggle with visualizing/understanding the difference between variance. I get standard deviation, but variance throws me for a loop.
Can you help close the gap?
Thanks for the complements, Tanner. They are very much appreciated.
Variance is very similar to Standard Deviation. It’s just the squaring of standard deviation.
Another way to understand variance is to forget Std Dev all together. Imagine you had a police line up. I’m thinking of the one from the movie Usual Suspects. There’s going to be variation on heights of the people on the line up. You could easily calculate the mean height, right? So visualize that mean height as a bar going across the suspects in the line up. That bar will be over the heads of the shorter people and through the face or body of the taller people, right? Think of variance as the total amount of that distance from the mean line squared divided by how ever many people are in the line up.
Perhaps a one-sentence explanation could be the a measure of how far off of mean samples are in aggregate where greater distance from the mean is amplified (because mathematically we are squaring it).
Does that help?
Missing the 2.3 in the original data in the example
Yes Richard, we have updated it!
Hi! shouldn’t the equation for Six Sigma be Y=F(x)+σ ?
here, ‘Y’ being the end product/result,
‘x’ being the variables/inputs used in order to achieve ‘Y’
and ‘σ’ being the defects/wastes that show up in the process?
How can six sigma be represented as only Y=F(x) ?
Hi Rakesh,
y = f(x) is a bit of an abstraction. What it means is that outputs are generally governed by some kind of process and are usually not completely random. If processes are deterministic, then we can identify how to optimize them. More on this in our article on Causal Theory here.
Best, Ted.
Hello, I need to understand six sigma. I am not sure where to start and how to study to understand the issues I am having with quality control model I am studying.
You’re in the right place, and it’s great that you’re looking to build a strong foundation in Six Sigma to address your quality control challenges. Six Sigma is a structured, data-driven methodology used to improve processes by identifying and eliminating defects. To get started, I recommend the following steps:
1. Understand the Basics of Six Sigma
Begin with the core principles, such as the DMAIC framework (Define, Measure, Analyze, Improve, Control), and key concepts like variation, defects per million opportunities (DPMO), and process capability. This overview of What is Six Sigma is a great starting point.
2. Choose a Certification Path
If you’re just beginning, the Six Sigma Green Belt level offers a comprehensive introduction. For more structured support, our Pass Your Six Sigma Green Belt course provides guided lessons, quizzes, and case studies tailored to real-world applications.
3. Apply What You Learn to Your Quality Control Model
Once you’ve grasped the basics, start mapping your current process using tools like SIPOC diagrams or flowcharts. Identify sources of variation and waste, and use basic statistical tools to analyze your data. This article on Seven Quality Tools can help you select the right techniques.
4. Continue Advancing
As your understanding grows, explore more advanced topics like hypothesis testing, control charts, and root cause analysis to refine your quality control model further.