What is a Spaghetti Diagram?
A Spaghetti Diagram also called a Spaghetti Chart or a Spaghetti Model is a visual flow of an activity or process used to identify areas for improvement. In other words, it is a visual representation that captures the basic flow of people, products, and process documents or papers.
Usually, if the roles are not well defined in an organization or standard work is not in place, people necessarily move around on the shop floor. Moreover, sometimes operators don’t even know how much distance they walk each day on the shop floor, leading to low productivity. A Spaghetti Diagram helps to redesign the layout to reduce the unnecessary movement of people, products, and information.
When Would You Use a Spaghetti Diagram?
The Spaghetti Diagram is one of the most widely used lean tools in the manufacturing, service, and logistics sectors. It helps to eliminate or reduce some of the 7 deadly wastes in processes such as transportation and motion.
Spaghetti Diagrams are also useful for assessing the wasteful movement in a fixed environment and an environment where people will do repetitive tasks or similar types of tasks multiple times in a day (For example: Assembly line on a shop floor, product movement from one building to another building, people movement in office space, etc.)
Why Would You Use a Spaghetti Diagram?
The basic purpose of a Spaghetti Diagram is to understand the current process, identify the bottlenecks in the process, and increase efficiency by eliminating the waste in the process.
Spaghetti Diagrams refer to a mapping tool used to identify the distance traveled by the product or people and the waiting time at each stage of the process. It also captures the walking patterns of the operators, especially back-and-forth movement for material or process operation. It resembles a spaghetti dish (hence the name). This tool helps to optimize the distance and restrict the movement (obviously, movement is a waste in the process).

Top management agreement or support is required to implement the Spaghetti Model because it sometimes requires a budget for layout changes or resources. Map the total path of the process, identify the opportunity for improvements, and list the items that require top management approval.
Document the actions and display the status of improvements (open and closed actions) on the shop floor or work area to monitor the progress. This is a long-term action plan and requires multiple iterations before finalizing the ideal process flow. It is recommended to conduct one more Spaghetti Diagram after the implementation of process improvements or redesigning the layout, machines, etc.
How to Make a Spaghetti Diagram
- Identify the process that needs to be improved.
- Collect required resources (like floor plan, colored pencils or markers, stopwatch, team, operators, flip charts, measuring tape, etc.)
- Draw the process layout on paper scaling down to match the distance between each work point, including all the equipment, walls, machinery, bins, etc.
- Draw the path of the process from start to end, and follow the movement of each employee continuously from beginning to end of the process.
- Each movement between two locations should be drawn with a continuous line. Uses different lines for each movement.
- Use different colored pencils or markers to capture different employee movements or material movements.
- Measure the time or distance of each path, number of hand-offs, shifts, operator, and other related information.
- Create a new diagram showing the ideal state of the process that reduces the walking time or eliminates the non-value-added activities.
How to use Spaghetti Diagram to improve the process or layout
- A Spaghetti Diagram only provides the outlook of the current state process. The team has to review and optimize the total distance and time for the process.
- Collect the ideas from the team, especially those who regularly work on the shop floor, and rearrange the layout in a “U” shape (aka circular shape) or “C’ shape, which specifically eliminates the waste.
- Keep continuous flow concept and move the parts to closer where they needed
- Identify the longest path or longest wait time in the process, and then try to reduce the distance
- While mapping the process, identify the bottlenecks. Use mistake-proof solutions, and try to automate the process wherever possible
- Lean Six Sigma experts help team members achieve a robust layout. Also, the team has to simulate the new process to see the new path, wait in the process, and make the appropriate adjustments.
- Explore using visual management to create a fast and reliable process.
- Once the new process is in-place, compute the dollars saved with the new process and communicate with the top management.
Do’s and Don’ts
Do’s
- Follow the movement of each individual and keep the line flowing in a singular path.
- Engage all the relevant operators for the spaghetti diagram exercise.
- Provide basic training to the operators on Spaghetti Diagrams.
- Use different colors for each operator and material.
- While mapping the process, identify the intersections, waiting points, bottlenecks, etc.
- Make sure to measure the time and distance of each path.
- Take consent from top management before performing the Spaghetti Diagram exercise.
Don’ts
- Don’t draw through walls, equipment, and also cupboards. In other words, draw only actual paths.
- You should not ignore any steps in the process.
- Don’t consider restrooms and personal activities in the exercise.
Practical Example in DMAIC
Example: A car battery manufacturer is unable to deliver the batteries on time to the dealer. A Lean Six Sigma team initiated the DMAIC approach. During the Measure phase of DMAIC, the team reviewed the product layout using the spaghetti chart, mapped the following steps, and indicated each operation with different colors.
- Order received from the dealer via email
- The production team collects the material from the store
- Produce lead strips from the lead ingots
- Apply lead paste on the lead strips
- Place the pasted lead strips in the curing chamber and perform curing
- Collect battery containers
- Place the cured plates in the battery containers in the assembly unit
- Perform charge and discharge cycles at the battery charging unit
- Finally, deliver the fully charged, fault-free batteries from the delivery point to the dealer
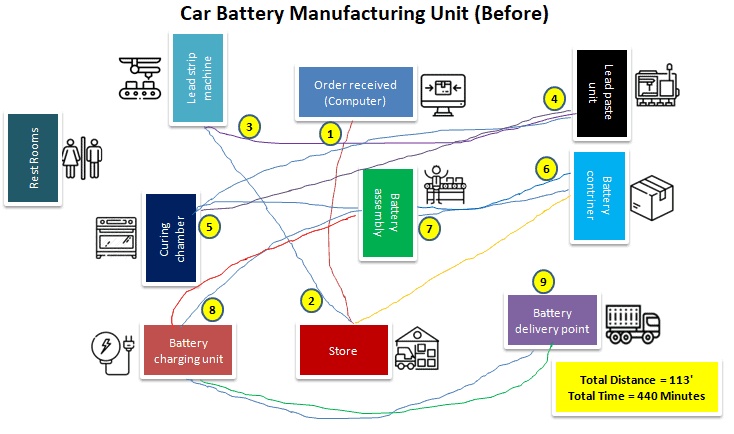
The team measured the total distance as well as the time required for the total operation. While mapping the process, the team identified bottlenecks in the waiting times and storage locations. The process improvement team discussed with the operators, analyzed various options, and finally came up with a U-shaped layout
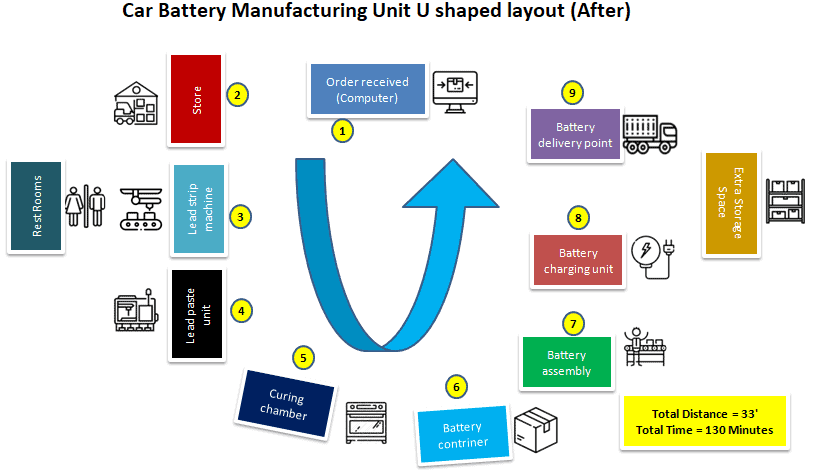
Now the above diagram is not looking like spaghetti, and also the total distance and time are reduced drastically.

Comments (6)
I think you need to replace “moment” with “movement” on this page several times…
Thank you for the note, Wiebke. Fixed.
Excellent method! Well explained.
Thank you!
Appreciate the kind words, Dr Jayasinghe!
to reference your article correctly when did you write this?
Hi Necia,
I first published this page on July 27th, 2017.
Best, Ted