One of the primary tasks in Six Sigma project implementation is defining the appropriate project management metrics. Project metrics help measure performance against business goals and objectives. How do we know the process is improved if you don’t measure the process?
Most of the Six Sigma projects deal with cost, quality, schedule, and customer satisfaction. Hence, most of the business metrics are closely related to them. Furthermore, metrics need to be measured and monitored periodically, which helps identify the appropriate process improvements in the project.
What are Metrics?
Metrics are needed to ensure that the requirements for the project are measurable and, therefore, controlled during the project. In other words, metrics tell the performance of a project’s attributes in measurable and comparable terms.

Well-organized project metrics are essential in Six Sigma projects since they help identify the improvement areas in the process.
How do you choose project management metrics?
Each organization requires exceptional metrics that align with its goal of the Six Sigma project:
- Identify the objective or goal of the project
- Establish the critical factors that need to be fulfilled to achieve the desired goal
- Capture each critical factor in the project and identify the methods to measure appropriately to achieve the goal
Why use project management metrics?
Appropriate project metrics will help to understand the process by removing uncertainty so that management can make well-informed decisions.
Categories of project management metrics
Project metrics are categorized into
- Primary project metrics
- Secondary project metrics
Primary Project Metrics: Primary project metrics are needed to ensure the requirements of the projects are measurable and, therefore, controlled during the project. In other words, the primary project metric should represent the Y (outcome) that a project wants to improve. It should be aligned with the key performance indicators of the organization.
Primary projects are identified during the Define phase but are finalized during the Measure phase of the project. The inputs for primary metrics come from various sources like customers, processes, suppliers, etc.
Examples of primary project metric
- Customer satisfaction
- Quality
- Time
- Cost
Secondary Project Metrics: Secondary project metrics are derived from the primary project metric. It gives the true picture of an ongoing process. Use the independent variables (Xs) to track the secondary metrics. Secondary metrics are usually numerical measures of primary metrics.
Identification of secondary project metrics is critical. It is challenging to monitor more secondary metrics and burdens to the management. Usually, the most important Critical to Quality (CTQs) become the primary metrics; hence, consider other CTQs as secondary metrics.
Examples of secondary project metrics:
- Average duration of receivables
- Number of defects
- Defects per unit(DPU)
Primary and secondary metrics should be measured and monitored continually. Furthermore, updates will be made as necessary during the Six Sigma project.
Classification of Project Management Metrics
Metrics can be classified in many ways depending on the business requirements. The main three types of metrics are
- Time
- Cost
- Quality

Time
Time metric helps assess the total time it takes to produce a product or service. Moreover, it captures the total cycle time and waiting or process idle time.
Process Lead Time
One of the critical time metrics is process lead time. It is the total time it takes to develop a product or service from start to end. Process lead time includes both value-added activities (activities that the customer is willing to pay for) and non-value-added activities.
Example: Suppose you visited a Supercuts and waited for 30 minutes, and the barber took 15 minutes to complete the cut. Then,
- Non-value added activity (waiting) = 30 minutes
- Value added activity or cycle time(hair cutting) = 15 minutes
- Total process lead time = 30+15 =45 minutes

TAKT Time
Takt time is used to synchronize the pace of production with the pace of sales. A sort of just-in-time production measure that helps remove and avoid waste.
Takt time = Net Available time / Customer Demand.
Example: Customer demand = 30 units/hour.
The process can do the following: 1: 20/hr; 2: 40/hr; 3:12/hr; 16/hr.
Net operating time is 60 mins/hour. The process is irrelevant here. The customer requirements are 30 units per hour. 60 / 30 = 2 mins.
Cost
Cost is an important financial metric that defines the cost of operating the process. It includes labor, material, and overhead costs.
CoPQ
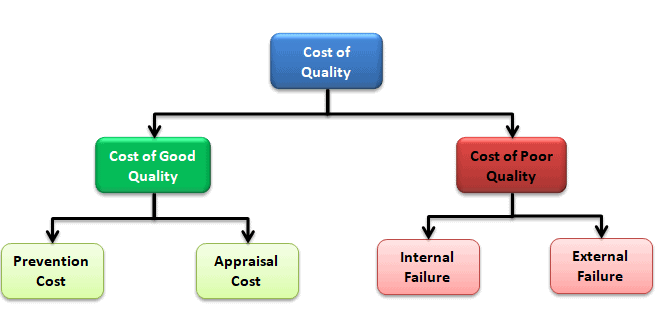
One of the key cost metrics is the Cost of Poor Quality (COPQ). It is the company’s total financial losses from performing incorrect things. For example, scrap, rework, repair, and warranty failure.
Categories of Cost of Quality: prevention cost, appraisal cost, internal failure cost, and external failure cost.
ROI
Return on Investment (ROI) = Gain realized / Effort spent.
This metric measures how efficient and profitable an endeavor (project, program, etc.) is. You could be building a valuable product but spending too much money to get it.
- ROI = ((end value – cost) / cost)
ROA
This metric measures how efficient management is in turning its holdings into earnings. It compares the company’s income with the assets it owns. Is it using those assets effectively to gain more income?
- Return on Assets (ROA) = Income / Assets.
Cost-Benefit Analysis
This is a forward-looking measure. It involves looking at the projected costs and returns of a project. It gives us data that we need to decide whether a project is worth doing. But it’s not just useful within a team. You can use a cost-benefit analysis to demonstrate the value of a project to people outside your team, like upper management.
- CBA = (Cost / Benefit)
Delivery
A Delivery metric typically refers to a measurable indicator or performance measure related to the efficiency, effectiveness, or success of the delivery process within a business or project. It assesses how well products, services, or projects are delivered to customers or stakeholders.
On-Time Delivery (OTD): Measures the percentage of orders delivered on or before the promised delivery date.
On-Time Delivery %= Number of orders delivered on or before the scheduled date/ Number of orders scheduled for delivery.
Example: The number of drawings scheduled in a month is 104, and 98 drawings are delivered before the end of the month. Calculate the % on-time delivery.
On-Time Delivery %= 98/104*100= 94.2%
Schedule
The Schedule metrics typically refer to measures or indicators used to assess and manage the timeliness and adherence to schedules in various processes or projects.
Schedule Variance (SV): The difference between the planned schedule and the actual progress. It helps determine if a project is ahead of or behind schedule.
The Schedule Variance (SV) is a project management metric that measures the difference between the earned value (EV) and the planned value (PV) at a specific point in time. The formula for Schedule Variance is:
SV=EV−PV
Example: In a project with a duration of 20 days and a total budget of $80,000, you are currently ten days into the project, representing 50% of the timeline. Therefore, by this point, you should have completed $40,000 (50% of the total budget) worth of work. However, only $20,000 of work has been completed. Find the schedule variance.
SV=EV−PV= $20,000-$40,000= -$20,000
Then, to express schedule variance as a percentage, divide:
SV (-$20,000) / PV($40,000) = -.5 or -50%
The above figure indicates that the project is currently 50% behind schedule. If the result is positive, it means your project is ahead of schedule.
Quality
Quality is a tricky, slippery word that changes definition depending on its context. You’ll hear very different answers if you ask, “What is quality?” in a group of engineers vs. a group of regular folks.
The ASQ defines it like this:
A subjective term for which each person or sector has its own definition. In technical usage, quality can have two meanings: 1) the characteristics of a product or service that bear on its ability to satisfy stated or implied needs; 2) a product or service free of deficiencies. According to Joseph Juran, quality means “fitness for use”; according to Philip Crosby, it means “conformance to requirements.”ASQ Quality Glossary
The quality metric helps to identify the concerns relating to process defects and can also improve customer satisfaction. Monitoring quality metrics is very important as it shows how often a product advances the entire process and tells the number of defects related to the process.
Different types of Quality metrics
Defects per Opportunity (DPO)
DPO stands for Defects per opportunity. This is a simple ratio. Take the number of defects you have in your process (usually found by sampling) and divide it by however many opportunities there are.
- DPO= Defects/Opportunity
Defects per Unit (DPU)
DPU, or Defects per unit, is a similar calculation to DPO, but instead of looking at opportunities, we’re looking at units
- DPU= Number of defects/Number of units
Defects per Million Opportunities (DPMO)
DPMO is based on DPO but in real-world manufacturing type numbers. If you’ve already worked out DPO for a sample, you can calculate DPMO by simply multiplying the decimal result (not the percentage) by one million.
- DPMO = (Defects / (sample size * opportunities per unit)) *1000000
First-Time Yield (FTY)
First-time yield is the most common way to calculate the process yield. It is the number of defect-free units coming out of a process compared to the number of units manufactured. In other words, it is the probability of a defect-free output from a process.
Rolled Throughput Yield (RTY)
RTY provides a probability that a unit will be generated by a process with no defects. In other words, it’s the probability that a multi-step process will produce a defect-free unit.
Consequential Metrics
Consequential metrics are a set of secondary metrics that measure any unintended or negative consequences that may result from achieving or improving the primary metric.
The primary metric is typically a key performance indicator (KPI) directly tied to a business or organization’s primary goal or objective. By monitoring consequential metrics, a company can ensure that its primary metric is not achieved at the expense of other important factors, such as customer satisfaction, employee morale, or brand reputation.
For example, a company’s primary metric might be revenue. Management strategy is to increase revenue by increasing the number of sales during festival season or special occasions. However, this strategy may have unintended consequences, such as longer wait times for delivery, increased customer complaints, or decreased customer satisfaction.
Benefits of Project Management Metrics
- They help to understand the current process performance.
- Metrics help to control the process and outputs.
- They improve process performance.
- Metrics may help in diagnosing the root cause of the problem.
Project Management Metrics Video
When you’re ready, there are a few ways I can help:
First, join 30,000+ other Six Sigma professionals by subscribing to my email newsletter. A short read every Monday to start your work week off correctly. Always free.
—
If you’re looking to pass your Six Sigma Green Belt or Black Belt exams, I’d recommend starting with my affordable study guide:
1)→ 🟢Pass Your Six Sigma Green Belt
2)→ ⚫Pass Your Six Sigma Black Belt
You’ve spent so much effort learning Lean Six Sigma. Why leave passing your certification exam up to chance? This comprehensive study guide offers 1,000+ exam-like questions for Green Belts (2,000+ for Black Belts) with full answer walkthroughs, access to instructors, detailed study material, and more.

Comments (2)
Can Process Cycle Efficiency be a KPI?
Hi Yashawi,
A KPI can be any set of quantifiable measurements used to gauge a company’s long-term success.
Process-centric KPIs tend to be measures of operational performance across the entire organization, so, yes, Process Cycle Efficiency could be one.
I would coach you to make it follow SMART criteria (eg Specific, Measurable, Attainable, Realistic, and Time-bound).