Z scores (Z value) is the number of standard deviations a score or a value (x) is away from the mean. In other words, the Z-score measures the dispersion of data. Technically, a Z-score tells you how many standard deviations value (x) are below or above the population mean (µ). If the Z value is positive, it indicates that the value or score (x) is above the mean. Similarly, if the Z value is negative, it means the value (x) is below the mean.
What is a Standard Normal Distribution?
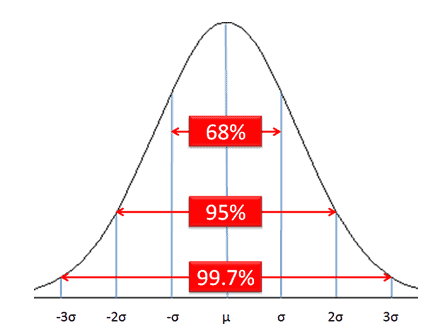
A Normal Standard Distribution curve is a symmetric distribution where the area under the normal curve is 1 or 100%. The standard normal distribution is a type of special normal distribution with a mean (µ) of 0 and a standard deviation of 1.
A standard normal distribution always has a mean of zero and has intervals that increase by 1. Each number on the horizontal line corresponds to the z-score. Hence, use Z Scores to transform a given standard distribution into something that is easy to calculate probabilities on as it can determine the likelihood of some event happening.
Any normal distribution with any value of mean (µ) and a sigma can be transformed into the standard normal distribution, where the mean of zero and a standard deviation of 1. This is also called standardization.
A Z-score tells how much standard deviation a value or score is from the mean (µ). For example, if a Z-score is negative 3 means the value (x) is 3 standard deviations left of the mean. Similarly, if the Z-score is positive 2.5 means the value (x) is 2.5 standard deviations to the right of the mean (µ).
This is a common transformation, so there is a reference chart that allows us to look up values. Those values correlate to the value under the normal distribution curve – in other words, what’s the chance of an event happening? We use the Z table to find the percent chance.
How to Interpret the Z-score Table
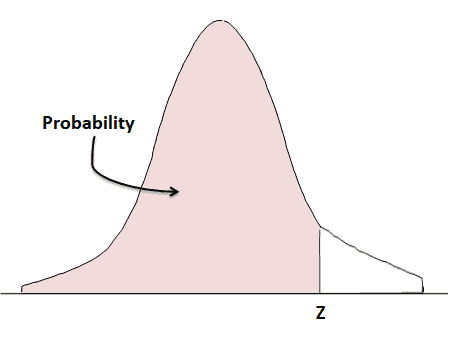
Most importantly, the Z-score helps to calculate how much area that specific Z-score is associated with. A Z-score table is also known as a standard normal table used to find the exact area. The Z-score table tells the total quantity of area contained on the left side of any score or value (x).
Case 1: Use the Z-table to see the area under the value (x)
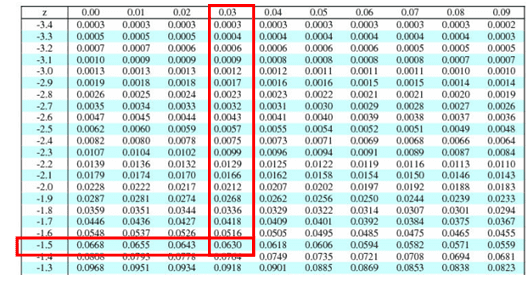
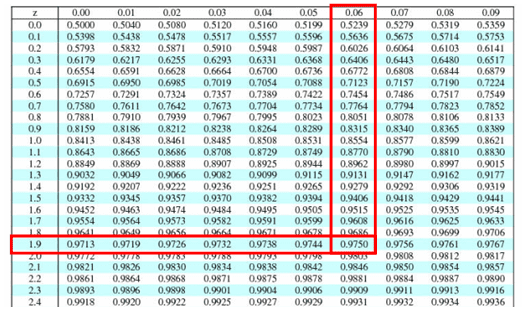
The first column in the Z-table top row corresponds to the Z-values and all the numbers in the middle correspond to the areas.
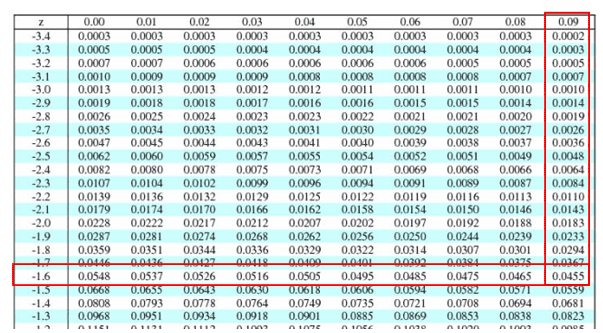
For example, a Z-score of -1.53 has an area of 0.0630 to the left of it. In other words, p(Z<-1.53) = 0.0630.
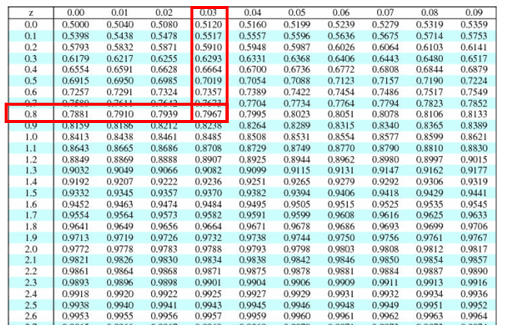
The standard normal table is also used to determine the area to the right of any Z-value by subtracting the area on the left from 1. Simply, 1-AreaLeft = Arearight
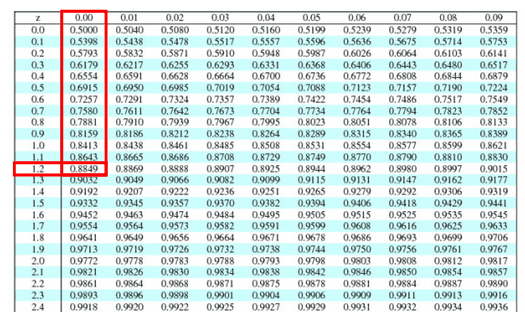
For example, a Z-score of 0.83 has an area of 0.7967 to the left of it. So, the Area to the right is 1 – 0.7967 = 0.2033.
Case 2: Use the Z-table to see what that score is associated with a specific area.
P(o<=Z<=x)
Pick the right Z row by reading down the right column.
Read across the top to find the decimal space.
Finally, find the intersection and multiply by 100.
For example, the Value of Z corresponds to an area of 0.9750 to the left of it is 1.96.
What if the Z Score is off the Chart?
Z score tables sometimes only go up to 3. But depending on the spread of the population, z scores could go on for a while. A Z score of 3 refers to 3 standard deviations. That would mean that more than 99% of the population was covered by the z score. There’s not a lot left, but there is some. Use Excel to find the actual value if your table doesn’t go that high.
How do you Calculate a Z Score?
How to Create Z score in Excel
Using the Z score, find the percentage by using the formula: 1-NORMSDIST(Z), where Z is your calculated Z Score.
How to Calculate a Z Score by Hand
There are 2 different situations you need to be aware of when calculating a z score:
Z score for a sample
Z score for a population
While the z-score equations look very similar, remember that calculating the standard deviation of a population is different than the way you calculate the standard deviation of a sample.
The formula for transforming a score or observation x from any normal distribution to a standard normal score is :
Calculating a Z Score (generic)
Calculating a Z Score for a Population
Instead of memorizing this formula, let’s see what it actually does
Experiment 1: What does a z-score actually measure?
Set μ = 0 and σ = 1. Now move x to:
1
2
3
Watch how far x moves from the mean.
👉 What you should observe:
z = distance in standard deviations
spacing is consistent
💡 Insight:
A z-score is not a value. It’s a distance.
Experiment 2: Change the Mean (μ)
Keep x fixed (e.g., x = 2). Now move μ left and right.
👉 Observe:
The entire curve shifts
z-score changes even though x didn’t move
💡 Insight:
Z-score is relative, not absolute.
Experiment 3: Change the Spread (σ)
Keep x and μ fixed. Increase σ from 1 → 4.
👉 Observe:
Curve becomes flatter and wider
z-score gets smaller
shaded probability changes
💡 Insight:
The same distance means different things depending on variability.
Experiment 4: Same x, Different σ → Different Probability
Try:
x = 2, μ = 0, σ = 1
x = 2, μ = 0, σ = 3
👉 Observe:
Same raw value
very different probabilities
💡 Insight:
Probability depends on distribution, not just the value.
Experiment 5: Connect to Z-Table Thinking
Adjust x until z ≈ 1.00, 2.00, 3.00
👉 Observe:
~84%, ~97.5%, ~99.9%
💡 Insight:
This is exactly what the Z-table is giving you.
Z Score for a Sample
How many parts in a population will be longer or greater than some number?
Z score examples using standard deviation
Example 1: Longer than / Greater than
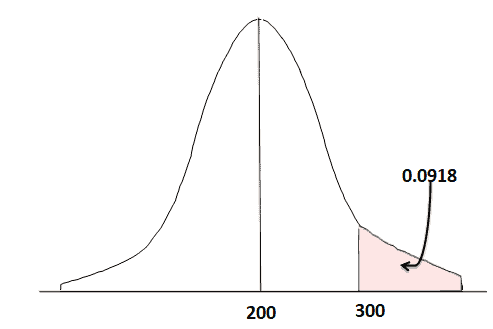
Hospital stays for admitted patients at a certain hospital are measured in hours and were found to be normally distributed with an average of 200 hours and a standard deviation of 75 hours. How many of these stays can be expected to last for longer than 300 hours?
x=300
x̅ = 200
s=75
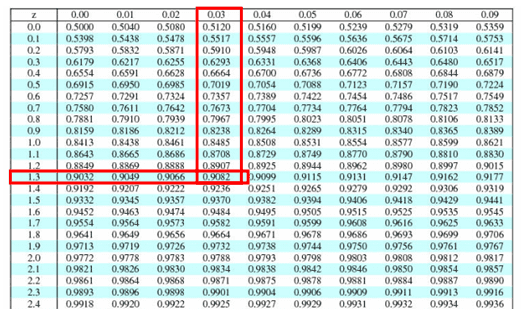
Z= x- x̅/s =(300-200)/75= 100/75= 1.33
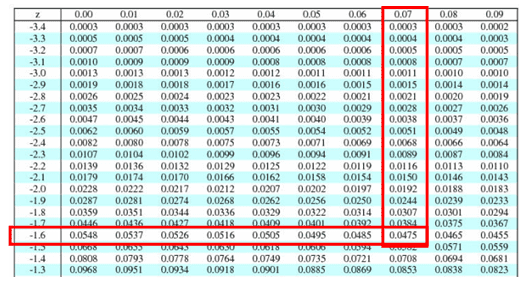
Z score from the table for 1.33 = 0.9082
Since, we are looking for longer, solution is P(x>300) = P(Z>1.33) = 1- P(Z<1.33)= 1-0.9082 = 0.0918 = 9.18%
A batch of batteries with an average of 60v and a Standard Deviation of 4v. If 9 batteries are selected at random, what is the probability that the total voltage of the batteries is greater than 530?
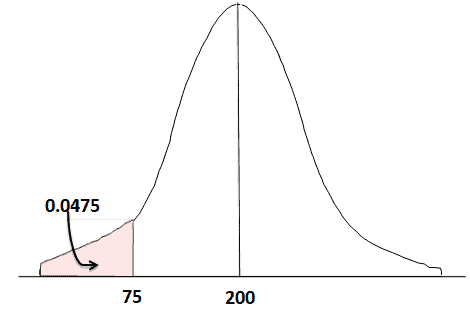
Hospital stays, for admitted patients at a certain hospital, are measured in hours and were found to be normally distributed with an average of 200 hours and a standard deviation of 75 hours. How many of these stays can be expected to last less than 75 hours?
x=75
x̅ = 200
s=75
Z= x- x̅/s =(75-200)/75= -125/75= -1.667
Z score from the table for -1.667 = 0.0475
Since we are looking for less than, the solution is = 4.75%
Example 3: Both less than AND greater than. (Percentage outside the range)
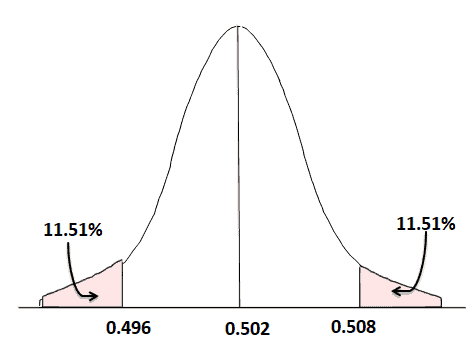
The mean inside diameter of a sample of 200 washers produced by a machine is 0.502 inches and the standard deviation is 0.005 inches. The purpose for which these washers are intended allow a maximum tolerance in the diameter of 0.496 to 0.508 inches, otherwise, the washers are considered defective. Determine the percentage of defective washers produced by the machine, assuming the diameters are normally distributed.
Less than
x=0.496
x̅ = 0.502
s=0.005
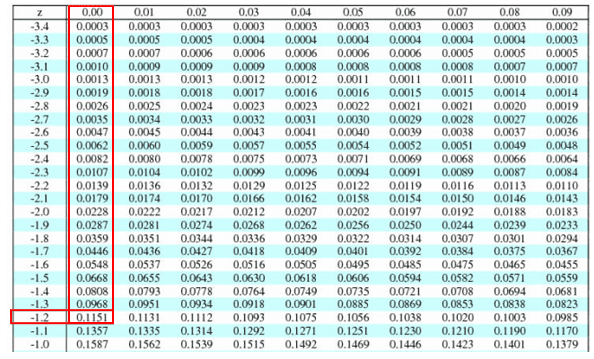
Z= x- x̅/s =(0.496-0.502)/0.005= -1.2
Z score from the table for -1.2 = 0.1151
Since we are looking for less than, solution for lower bound = 11.51%
More than
x=0.508
x̅ = 0.502
s=0.005
Z= x- x̅/s =(0.508-0.502)/0.005= 1.2
Z_score from the table for 1.2 = 0.8849
Since we are looking for more than that, the solution is 1-0.8849 = 0.1151 = 11.51%
So, the total is 23.02%
Example 4: Both upper and lower bound. (Percentage Inside the range.)
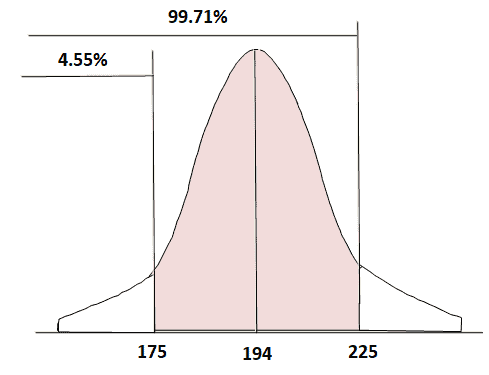
The weights of 500 American men were taken and the sample mean was found to be 194 pounds with a standard deviation of 11.2 pounds. What percentages of men have weights between 175 and 225 pounds?
P(X<175)
x=175
x̅ = 194
s=11.2
Z= x- x̅/s =(175-194)/11.2= -1.6964
Z_score from the table for -1.6964= 0.0455
P(X<175) = 4.55%
P(X<225)
x=225
x̅ =194
s=11.2
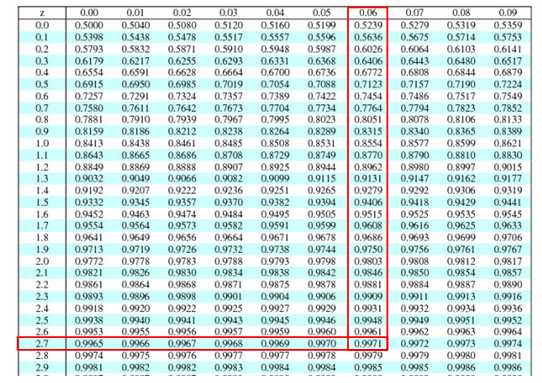
Z= x- x̅/s =(225-194)/11.2= 2.7678
Z score from the table for 2.7678 = 0.9971=99.71%
Since we are looking for weights between 175 and 225, P(175<x<225) = 99.71%-4.55% = 95.16%
Question: This formula Z = (X - μ)/σ is used to calculate a Z score that, with the appropriate table, can tell a Belt what ____________________________________.
A) Ratio the area under the curve to the total population
Question: A battery manufacturer was considering changing suppliers for a particular part. The purchasing manager required that the average cost of the part be less than or equal to $32 in order to stay within budget. A sample of the 32 initial deliveries had a Mean of the new product upgrade price of $28 with an estimated Standard Deviation of $3. Based on the data provided, the Z value for the data assuming a Normal Distribution is?
When you're ready, there are a few ways I can help:
First, join 30,000+ other Six Sigma professionals by subscribing to my email newsletter. A short read every Monday to start your work week off correctly. Always free.
---
If you're looking to pass your Six Sigma Green Belt or Black Belt exams, I'd recommend starting with my affordable study guide:
You've spent so much effort learning Lean Six Sigma. Why leave passing your certification exam up to chance? This comprehensive study guide offers 1,000+ exam-like questions for Green Belts (2,000+ for Black Belts) with full answer walkthroughs, access to instructors, detailed study material, and more.
I originally created SixSigmaStudyGuide.com to help me prepare for my own Black belt exams. Overtime I've grown the site to help tens of thousands of Six Sigma belt candidates prepare for their Green Belt & Black Belt exams. Go here to learn how to pass your Six Sigma exam the 1st time through!
A process measurement has a mean of 758 and a standard deviation of 19.4. If the specification limits are 700 and 800, what percent of product can be expected to be of limits assuming a normal distribution?
From the above example, Z value of 2.164 s 98.46; instead of 0.0154. Your value of 0.0154 would be correct if the mean value of the specifications was 716 instead of 800.
Further, if the data crosses 2 standard devations it should be greater than 95% .
Thank you for these examples. In example 4, I calculated (175-194)/11.2 = -1.696 for the first limit, and rounded up to -1.7, so the Z table number I got was .0446. You did not round up and referenced -1.69 and the Z table number you got was .0455. Is there guidance on rounding when using these tables? I don’t recall anything like this when I went through the Villanova SSBB class. Thanks.
Thanks for flagging this! I was just wondering the exact same thing. Example 4 appears to be rounded incorrectly. I got the answer of 95.26%. Did you get a response?
You’re absolutely right to dig into the precision here. In Example 4, the Z value for 175 lbs was calculated as -1.6964. If we round this to -1.70, the Z table gives us an area of 0.0446. For the upper limit at 225 lbs, the Z value rounds to 2.77, which gives an area of 0.9972. So:
P(175 < x < 225) = 0.9972 – 0.0446 = 0.9526 or 95.26%
You’re absolutely correct. The example could be adjusted for tighter accuracy based on how Z-scores are rounded. We used -1.69 (0.0455) in the example for illustrative purposes, but your method is equally valid and even a bit more precise. Thanks again for pointing it out!
When using Z tables, rounding is more of a convention than a strict rule, and it largely depends on the precision of the table you’re using. Many Z tables go to two decimal places, so a Z score like -1.696 could reasonably be rounded to -1.70 or -1.69, depending on which value is closer. In your case, -1.696 is indeed closer to -1.70, which would give you an area of 0.0446. Meanwhile, using -1.69 gives 0.0455, as we used in the example.
In practice, either is fine as long as you’re consistent and understand the slight differences in precision. Most Six Sigma applications tolerate this small variance, especially when working within control limits or estimating probabilities. If your table or calculator supports more decimal places, you can go with the more precise value.
Thanks for pointing this out. It’s a great example of how attention to detail sharpens your statistical thinking!
i need to find more math & statistic problem to practice, seems i come to the right place! thank you! is there any other ways i can find on the internet?
I’ve put this answer and the complete question walkthrough in the Pass Your Six Sigma Green Belt paid course. Members can find it there. If you’d like to learn how to solve problems like this – and thousands of others – consider joining my Green Belt Study Guide program here.
Hi, I really don´t get the batteries problem? Sigma Xbar is a measure of the error of the sample distribution and should be = 4/3. So the 62v part of the question is clear. I don´t get why the first part is true than, could you help me?
What is the Ppk of a process with a spread of 24 units, an average of 68, an upper limit of 82 and a lower limit
of 54?
A. 1.68
B. 2.00
C. 4.00
D. 4.42
Correct Answer: None of the listed choices match exactly.
The calculated value is approximately 1.17, so if there’s a typo in the options, the closest reasonable estimate would have been listed. None of the provided options (A. 1.68, B. 2.00, C. 4.00, D. 4.42) are correct.
None of the listed answer choices match this value exactly, which suggests a possible misunderstanding in interpreting the “spread.” If instead the given spread of 24 units refers to 6σ (as is standard), then σ = 4, and the above is correct.
If the 24-unit spread were mistakenly interpreted as 3σ (which is non-standard), then σ = 8, and:
(USL – μ) / (3×8) = 14 / 24 = 0.583
(μ – LSL) / (3×8) = 14 / 24 = 0.583
That gives a Ppk = 0.583, still not matching any options. The closest answer match (and possibly a typo or error in the question) might require revisiting the source of the question. Based on standard Six Sigma interpretation (spread = 6σ), the correct Ppk is 1.17.
Using this partial Z Table, how many units from a month’s production run are expected to not satisfy customer requirements for the following process?
Upper specification limit: 7.2 Lower specification limit: 4.3 Mean of the process: 5.9 Standard Deviation: 0.65 Monthly production: 450 units
Please choose the correct answer.
Response:
3
7
10
12
Your calculation is largely correct and shows a solid understanding of how to estimate the proportion of products falling outside the specification limits using the normal distribution. Here’s a detailed breakdown and a few clarifications:
Given Data:
Mean (μ) = 5.9
Standard Deviation (σ) = 0.65
USL = 7.2
LSL = 4.3
Z-Score Calculations:
ZUSL = (7.2 – 5.9) / 0.65 = 2.0 → From the Z-table, P(Z > 2.0) = 0.0228
Which of the following describes the 95% confidence
interval of a 20% absentee rate in a department with
30 people?
(A) 6% to 34%
(B) 8% to 32%
(C) 13% to 27%
(D) 17% to 23%
In theory, Z-scores can be any real number, including extremely high or low values such as +300 or –300. However, in practice, such Z-scores are extraordinarily rare and typically indicate one of the following:
A data entry error or a mistake in calculations
A misapplication of the Z-score formula (e.g., incorrect mean or standard deviation)
Data that does not follow a normal distribution, possibly with extreme outliers
For context, in a normal distribution:
99.7% of values lie within ±3 standard deviations (Z-scores between –3 and +3)
A Z-score of ±6 already captures nearly all data (99.9999998%)
A Z-score of ±300 implies a value that is 300 standard deviations away from the mean, which is essentially impossible for real-world, normally distributed data.
If you’re seeing such values, it’s worth double-checking your calculations or the source data.
To learn how to correctly calculate and interpret Z-scores, consider these resources:
Here I m wanting to know about how to use z table & how to calculate the rejection in PC’s & percentage, my question is –
A lot of 1000 pivot pins, specification length of pin is 15.0+/-0.2 mm, sample of 50 PC’s were inspected mean & std. Deviation was to be 15.05 & 0.1 mm respectively. Calculate how many PCs are likely to be recjeted from the lot. Use z table & pls give pictorial view.
This kind of problem is excellent practice for understanding the relationship between cumulative probabilities and Z-scores—a foundational skill for anyone preparing for Six Sigma exams. If you’re brushing up for your certification, you might benefit from our structured training:
The area to the left of Z is 1 – Z. Thus 1 – 0.0668 = 0.9332. Or 93.32%.
My comment: Z should be -1.5
following the hypothesis test : Ha: xa or= 60; hence since Z=-1.5; Alpha= 0.06881; the question is related to the value less than 60 (left side) hence it should be only 6.881%
You are absolutely right in identifying a critical point—the Z value should indeed be negative if the sample mean were less than the population mean. However, in this case, the sample mean is greater than the population mean, and the question asks for the probability that the average voltage is less than 62. Here’s the correct interpretation:
Given:
Population mean (μ) = 60
Sample size (n) = 9
Standard deviation (σ) = 4
Standard Error (SE) = σ / √n = 4 / 3 ≈ 1.333
Z = (62 – 60) / (4 / √9) = 2 / (4/3) = 1.5
Since we are looking for the probability that the average is less than 62, and 62 is greater than the mean of 60, the Z score is +1.5. The area to the left of Z = 1.5 gives us P(X̄ < 62).
From standard normal distribution tables, P(Z < 1.5) = 0.9332, or 93.32%.
Clarification: If the question were about the probability of a sample mean being less than 60, then you’d indeed use a negative Z score. But because we’re comparing to a value greater than the mean, the Z score is positive, and the 93.32% is correct.
For more help mastering concepts like this, check out these comprehensive courses:
my understanding is that Sample standard deviation is = (population standard deviation)/(sqrt(n)
but this is contrary to what is used in e.g. 1.1 above.
What could be the reason that we are using, sample s.d = population s.d * sqrt(n) formula above
The weights of 500 American men were taken and the sample mean was found to be 194 pounds with a standard deviation of 11.2 pounds. What percentages of men have weights between 175 and 225 pounds. P of X>175 and <225
should be 1-.0455 correct which changes the problem..please clarify
Clarification: Your reference to “1 – 0.0455” would apply if you were only looking for P(X > 175), but since we’re calculating the percentage between 175 and 225, we need the area between the two Z-scores.
For more help mastering normal distribution and Z-score applications, check out these comprehensive resources:
I think your first step is to choose an organization to be certified with. There are many of them. I would suggest getting started with ASQ or IASSC.
From there you would be able to a) see what belt you want to go for and b) be able to search for training.
Please remember that not all training covers all of the different certification organizations, so you want to make sure that whatever training you select is aligned with your desired organization. Prices for training and actual certification costs are are all different based on what you select.
Dear Ted, all,
If you want to write an equation in one single line, please take into account the operator precedence.
For instance, the following
Z= x- x̅/s =0.496-0.502/0.005= -1.2
should be written
Z= x- x̅/s =(0.496-0.502)/0.005= -1.2
or else, according to the order of operations, the result would be -99.904.


Comments (58)
A process measurement has a mean of 758 and a standard deviation of 19.4. If the specification limits are 700 and 800, what percent of product can be expected to be of limits assuming a normal distribution?
A. 1.7%
B. 7.1%
C. 3.4%
D. 2.9%
I’ve put this answer and the complete question walkthrough in the Pass Your Six Sigma Green Belt paid course. Members can find it there.
Hello,
From the above example, Z value of 2.164 s 98.46; instead of 0.0154. Your value of 0.0154 would be correct if the mean value of the specifications was 716 instead of 800.
Further, if the data crosses 2 standard devations it should be greater than 95% .
Pl. correct if i am wrong.
Regards,
Hari Kiran
Hi all,
I’ve added this question – and the correct answers to my paid program.
If you’d like to learn how to solve problems like this – and thousands of others – consider joining my Green Belt Study Guide program here.
In example 4, why did you look for z of (-2.76) while it is a positive number? please explain. thank you.
I’ve put this answer and the complete question walkthrough in the Pass Your Six Sigma Green Belt paid course. Members can find it there.
Thank you for these examples. In example 4, I calculated (175-194)/11.2 = -1.696 for the first limit, and rounded up to -1.7, so the Z table number I got was .0446. You did not round up and referenced -1.69 and the Z table number you got was .0455. Is there guidance on rounding when using these tables? I don’t recall anything like this when I went through the Villanova SSBB class. Thanks.
Thanks for flagging this! I was just wondering the exact same thing. Example 4 appears to be rounded incorrectly. I got the answer of 95.26%. Did you get a response?
You’re welcome—and great catch!
You’re absolutely right to dig into the precision here. In Example 4, the Z value for 175 lbs was calculated as -1.6964. If we round this to -1.70, the Z table gives us an area of 0.0446. For the upper limit at 225 lbs, the Z value rounds to 2.77, which gives an area of 0.9972. So:
You’re absolutely correct. The example could be adjusted for tighter accuracy based on how Z-scores are rounded. We used -1.69 (0.0455) in the example for illustrative purposes, but your method is equally valid and even a bit more precise. Thanks again for pointing it out!
Great question, and a really sharp observation!
When using Z tables, rounding is more of a convention than a strict rule, and it largely depends on the precision of the table you’re using. Many Z tables go to two decimal places, so a Z score like -1.696 could reasonably be rounded to -1.70 or -1.69, depending on which value is closer. In your case, -1.696 is indeed closer to -1.70, which would give you an area of 0.0446. Meanwhile, using -1.69 gives 0.0455, as we used in the example.
In practice, either is fine as long as you’re consistent and understand the slight differences in precision. Most Six Sigma applications tolerate this small variance, especially when working within control limits or estimating probabilities. If your table or calculator supports more decimal places, you can go with the more precise value.
Thanks for pointing this out. It’s a great example of how attention to detail sharpens your statistical thinking!
an IQ score has z score of 175. What is the score if the mean is 100 and the standard deviation is 15.
To find the actual IQ score corresponding to a Z-score, we use the formula:
X = μ + Z × σ
Substituting the values:
X = 100 + 1.75 × 15 = 100 + 26.25 = 126.25
So, an IQ score with a Z-score of 1.75 corresponds to an actual score of 126.25.
To deepen your understanding of Z-scores and their applications in Six Sigma and statistical analysis, these courses are great starting points:
i need to find more math & statistic problem to practice, seems i come to the right place! thank you! is there any other ways i can find on the internet?
Hi Chen,
I offer 1000 questions in my my Green Belt Study Guide program here.
What kind of statistics problems are you looking for?
Problem 1, solution is 9.18% 🙂
Yes, it is.
Hi, z-transf #1:
Using the Z table, we find the area to the right of the Z is 0.7976. So, there is a 79.76%. In the table it´s 79.67%
🙂
I’ve put this answer and the complete question walkthrough in the Pass Your Six Sigma Green Belt paid course. Members can find it there. If you’d like to learn how to solve problems like this – and thousands of others – consider joining my Green Belt Study Guide program here.
Hi, I really don´t get the batteries problem? Sigma Xbar is a measure of the error of the sample distribution and should be = 4/3. So the 62v part of the question is clear. I don´t get why the first part is true than, could you help me?
What is the Ppk of a process with a spread of 24 units, an average of 68, an upper limit of 82 and a lower limit
of 54?
A. 1.68
B. 2.00
C. 4.00
D. 4.42
I’ve tried solving this a couple of times to no avail.
p>Using the given data:
We calculate Ppk as:
Ppk = min[(USL - Mean) / (3σ), (Mean - LSL) / (3σ)]
    = min[(82 - 68) / (3*4), (68 - 54) / (3*4)]
    = min[14 / 12, 14 / 12] = 1.167
Correct Answer: None of the listed choices match exactly.
The calculated value is approximately 1.17, so if there’s a typo in the options, the closest reasonable estimate would have been listed. None of the provided options (A. 1.68, B. 2.00, C. 4.00, D. 4.42) are correct.
For more on how to calculate Ppk and related metrics, check out: Process Capability (Cp, Cpk, Pp, and Ppk).
can you sold it? im straggling. tried to do as the above example and o lack ;-\
Ami – see above
To calculate the Ppk (Process Performance Index), we use the formula:
Ppk = min[(USL – μ) / (3σ), (μ – LSL) / (3σ)]
Where:
Now calculate:
Ppk = min(1.17, 1.17) = 1.17
None of the listed answer choices match this value exactly, which suggests a possible misunderstanding in interpreting the “spread.” If instead the given spread of 24 units refers to 6σ (as is standard), then σ = 4, and the above is correct.
If the 24-unit spread were mistakenly interpreted as 3σ (which is non-standard), then σ = 8, and:
That gives a Ppk = 0.583, still not matching any options. The closest answer match (and possibly a typo or error in the question) might require revisiting the source of the question. Based on standard Six Sigma interpretation (spread = 6σ), the correct Ppk is 1.17.
For more on Ppk and similar concepts, check out: Ppk – Process Performance Index
And consider refining your skills through these courses:
Can you help me to resolve this problem…
Using this partial Z Table, how many units from a month’s production run are expected to not satisfy customer requirements for the following process?
Upper specification limit: 7.2 Lower specification limit: 4.3 Mean of the process: 5.9 Standard Deviation: 0.65 Monthly production: 450 units
Please choose the correct answer.
Response:
3
7
10
12
What have you tried so far, Tharik?
Mean : 5.9
SD : .65
USL : 7.2
LSL : 4.3
Out Of Limit ;
Z1 = 7.2-5.9 / 0.65 : 2 , Z Table : .0228
Z2 = 5.9-4.3/ 0.65 : 2.46, Z Table : .0069
So, P(X=Z2) : 0.0228+ 0.0069 = 2.97%
Total unsatisfied customer requirement : 450*2.97%=13.81
You’re very close with your approach, and your logic is solid! Here’s the refined calculation with precise Z-table values:
Calculating Z-scores:
Total probability of non-conformance = 0.02275 + 0.00692 = 0.02967 or 2.97%
Number of defective units = 450 × 0.02967 ≈ 13 units
Correct answer: Not listed in the choices. The closest is 12, but the correct answer is 13 units.
For further study on how to handle Z-scores and process capability, take a look at these resources:
Mean : 5.9
SD : .65
USL : 7.2
LSL : 4.3
Out Of Limit ;
Z1 = 7.2-5.9 / 0.65 : 2 , Z Table : .0228
Z2 = 5.9-4.3/ 0.65 : 2.46, Z Table : .0069
So, P(X=Z2) : 0.0228+ 0.0069 = 2.97%
Total unsatisfied customer requirement : 450*2.97%=13.81
Unsatisfied customers/month : 450*2.97%=13.81
Your calculation is largely correct and shows a solid understanding of how to estimate the proportion of products falling outside the specification limits using the normal distribution. Here’s a detailed breakdown and a few clarifications:
Given Data:
Z-Score Calculations:
Total Out-of-Spec Proportion:
P(Out of Limits) = P(Z > 2.0) + P(Z < -2.46) = 0.0228 + 0.0069 = 0.0297 or 2.97%
Number of Defective Units in a Batch of 450:
450 × 2.97% ≈ 13.37 units (rounded to two decimal places)
So you’re very close, but the final defect count is slightly better represented as 13.37 units rather than 13.81. Nice work overall!
And if you’re preparing for a Six Sigma certification, our guided courses will help you master this and much more:
How can I find the z-score normalization for a set of data in excel format?
Hi Rocky,
Great question! Z-score normalization in Excel is a straightforward process. Here’s how you can do it step-by-step:
Step-by-Step Instructions
Use the formula:
=AVERAGE(range)Use the formula:
=STDEV.P(range)(for population) or=STDEV.S(range)(for sample)Use the formula:
=(A2 - mean) / std_devReplace
A2with the cell containing your data point, and use the actual cells with the calculated mean and standard deviation.Example
Drag the formula down to compute Z-scores for the entire dataset.
Want to master more statistical techniques like this? Check out:
Which of the following describes the 95% confidence
interval of a 20% absentee rate in a department with
30 people?
(A) 6% to 34%
(B) 8% to 32%
(C) 13% to 27%
(D) 17% to 23%
The answer to this question is covered here.
Is it possible to have a z-score of + 300 or – 300?
In theory, Z-scores can be any real number, including extremely high or low values such as +300 or –300. However, in practice, such Z-scores are extraordinarily rare and typically indicate one of the following:
For context, in a normal distribution:
A Z-score of ±300 implies a value that is 300 standard deviations away from the mean, which is essentially impossible for real-world, normally distributed data.
If you’re seeing such values, it’s worth double-checking your calculations or the source data.
To learn how to correctly calculate and interpret Z-scores, consider these resources:
How to calculate Z value in below question?
Question:
When σ = 10, what sample size is needed to specify a 95% confidence interval of ±3 units from the mean?
Here, Sample size = ((Z*σ )/(margin of error))^2.
In the formula, Z value need to find from Z- table. But how it can be found?
Excellent question! You’re on the right track with the formula for determining sample size:
n = ((Z × σ) / E)²
How to find the Z value from a Z-table:
A 95% confidence level means we want the middle 95% of the normal distribution. That leaves 2.5% in each tail.
Now apply the formula:
So, the required sample size is approximately 43 (always round up when calculating sample size).
To master statistical methods like these, you’ll benefit from the in-depth explanations in the following courses:
Here I m wanting to know about how to use z table & how to calculate the rejection in PC’s & percentage, my question is –
A lot of 1000 pivot pins, specification length of pin is 15.0+/-0.2 mm, sample of 50 PC’s were inspected mean & std. Deviation was to be 15.05 & 0.1 mm respectively. Calculate how many PCs are likely to be recjeted from the lot. Use z table & pls give pictorial view.
Great question! Here’s how to calculate the number of likely rejected pieces using the Z-table and standard deviation:
Using Z-scores:
From the Z-table:
Percentage within specs: 93.32% – 0.62% = 92.70%
Rejected percentage = 100% – 92.70% = 7.30%
Estimated number of rejected pieces from the lot = 73
To build strong foundational skills in statistics and quality tools like Z-tables, consider enrolling in one of these comprehensive courses:
In a distribution exactly normal, 7% of the items are under 35 and 79% are under 63. What is the mean and standard deviation of the distribution
To find the mean (μ) and standard deviation (σ) of a normal distribution given two cumulative probabilities, we follow these steps:
Step 1: Convert probabilities to Z-scores using a standard normal distribution table or inverse normal function:
Step 2: Use the Z-score formula:
So for the two points:
Subtract equation (1) from equation (2):
Now plug σ back into equation (1):
Answer:
This kind of problem is excellent practice for understanding the relationship between cumulative probabilities and Z-scores—a foundational skill for anyone preparing for Six Sigma exams. If you’re brushing up for your certification, you might benefit from our structured training:
I have a question with regards to the following:
Question
What is the probability that the average voltage is less than 62?
Answer
The expected value would be 60.
Z = 62-60 / (4 / Sqrt(9)) = 2 / (4/3) = 3/2 = 1.5.
The area to the left of Z is 1 – Z. Thus 1 – 0.0668 = 0.9332. Or 93.32%.
My comment: Z should be -1.5
following the hypothesis test : Ha: xa or= 60; hence since Z=-1.5; Alpha= 0.06881; the question is related to the value less than 60 (left side) hence it should be only 6.881%
You are absolutely right in identifying a critical point—the Z value should indeed be negative if the sample mean were less than the population mean. However, in this case, the sample mean is greater than the population mean, and the question asks for the probability that the average voltage is less than 62. Here’s the correct interpretation:
Since we are looking for the probability that the average is less than 62, and 62 is greater than the mean of 60, the Z score is +1.5. The area to the left of Z = 1.5 gives us P(X̄ < 62).
From standard normal distribution tables, P(Z < 1.5) = 0.9332, or 93.32%.
Clarification: If the question were about the probability of a sample mean being less than 60, then you’d indeed use a negative Z score. But because we’re comparing to a value greater than the mean, the Z score is positive, and the 93.32% is correct.
For more help mastering concepts like this, check out these comprehensive courses:
Hi Ted,
It looks like the title of Example 4 should be “Percentage INSIDE/WITHIN the range” – as Example 3 dealt with outside the range.
Owen
Thanks, Owen!
Hi Ted,
my understanding is that Sample standard deviation is = (population standard deviation)/(sqrt(n)
but this is contrary to what is used in e.g. 1.1 above.
What could be the reason that we are using, sample s.d = population s.d * sqrt(n) formula above
Hello JEEVAN SINGH,
We have updated the article with detail explanation.
Thanks
Confused.
The weights of 500 American men were taken and the sample mean was found to be 194 pounds with a standard deviation of 11.2 pounds. What percentages of men have weights between 175 and 225 pounds. P of X>175 and <225
should be 1-.0455 correct which changes the problem..please clarify
We are given:
To find this probability, we’ll convert the values to Z-scores:
Next, we look up these Z-scores in the standard normal distribution table:
So, the probability of a man weighing between 175 and 225 pounds is:
P(175 < X < 225) = P(Z < 2.768) – P(Z < -1.696) = 0.9972 – 0.0455 = 0.9517 or 95.17%
Clarification: Your reference to “1 – 0.0455” would apply if you were only looking for P(X > 175), but since we’re calculating the percentage between 175 and 225, we need the area between the two Z-scores.
For more help mastering normal distribution and Z-score applications, check out these comprehensive resources:
Never mind, I get it!
Glad to help, Richard!
I want to write all the certifications of 6 sigmas. How much are the tutorial costs and examination registrations?
Good question, John.
I think your first step is to choose an organization to be certified with. There are many of them. I would suggest getting started with ASQ or IASSC.
From there you would be able to a) see what belt you want to go for and b) be able to search for training.
Please remember that not all training covers all of the different certification organizations, so you want to make sure that whatever training you select is aligned with your desired organization. Prices for training and actual certification costs are are all different based on what you select.
Dear Ted, all,
If you want to write an equation in one single line, please take into account the operator precedence.
For instance, the following
Z= x- x̅/s =0.496-0.502/0.005= -1.2
should be written
Z= x- x̅/s =(0.496-0.502)/0.005= -1.2
or else, according to the order of operations, the result would be -99.904.
Thank you, Steve. I have made the necessary updates in all the relevant sections.
Thanks