Data Sampling is the selection of statistical samples from the population to estimate the characteristics of the entire population. It is the main technique for data collection when you want to create a statistically sound conclusion from a subset of a population of data. Data sampling helps to make statistical inferences about the population.
Populations and Samples
Before we talk about Data Sampling Techniques & Uses, we have to define the terms population and sample.
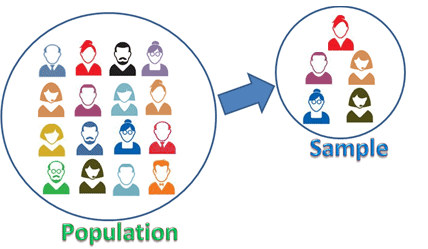
Population: Population is the group of elements which has common characteristics. It is a collection of observations we would like to make inferences about.
Sample: A sample is the subset of a population
Sampling: A collection of samples from the population is a sampling. In other words, sampling units are an overlapping collection of elements from the population.
Why Use Data Sampling?
Sometimes, gathering information on a complete population is too expensive, time-consuming, or nonsensical.
For example, we might take samples when:
- The process we are measuring would require destructive testing (think taste tests, car crash tests, etc.)
- Getting data from the entire population is too expensive or would take longer than we have.
- Getting total population data is just too hard.
For example, CNN’s coverage of an election cycle in the United States makes it impossible to ask every voter how they voted. Even if it were, not all would answer. Instead, they use exit polls to derive statistical conclusions about the population as a whole. In a DMAIC sense, this is most common in the Measure phase.
We would unlikely use sampling when the events and products are unique and cannot be replicable.
To get around these constraints, Black Belts or statisticians extract the samples from the statistical population and make inferences about the population.
Sampling Error
Sampling error is the deviation between the estimate of an ideal sample and the true population.
The core assumption of data sampling is that samples are a subset of the population, and the sample mean is equal to the mean of the population.
To the degree that doesn’t happen is the term Sampling Error
We can reduce sampling error by following sampling best practices, like having a large enough sample size, choosing the right kind of sampling, and avoiding sampling bias.
Data Sampling Methods
When taking a sample from a larger population, you must make sure that the samples are of an appropriate size and without bias. You should address these concerns in your data collection plan.
There are Two Types of Sampling:
- Probability Sampling
- Non-probability Sampling
Probability Sampling:
Every element in the sample population has an equal chance of being selected. A sampling method is biased if every member of the population doesn’t have an equal likelihood of being in the sample.
Different Types of Probability Sampling
- Simple Random Sampling
- Stratified Sampling
- Systematic Sampling
- Cluster Sampling
Simple Random Sampling: It is a method of sampling in which every element of the universe has an equal probability of being chosen. For example, choose an individual from a lottery. The advantage of this method is that it is free from personal bias, and the universe gets fairly represented by samples.

Stratified Sampling: The population is broken down into non-overlapping groups. In other words, strata (elements within the subgroups that are homogenous or heterogeneous). Then random samples are taken from each stratum, representing the entire population. The advantage of this method is it covers all the elements of the population. But there is a possibility of bias at the time of classification of the population.
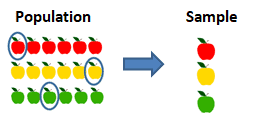
Systematic Sampling: Samples are selected from the population according to a pre-determined rule. In other words, every nth element is selected from the population as a sample. Arrange all the elements in a sequence and then select the samples from the population at regular intervals.

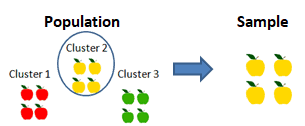
Cluster Sampling: The population is divided into many different clusters, then clusters or subgroups are randomly selected. For example, clusters are of different ages, sex, locations, etc.
Different Types of Non-probability Sampling
- Purposive Sampling
- Convenience Sampling
- Quota Sampling
- Snowball/referral Sampling
Purposive Sampling: Purposive sampling is also known as judgment sampling. Samples are selected based on the purpose or intention of the research. The method is flexible to include those items in the sample that are of special significance.
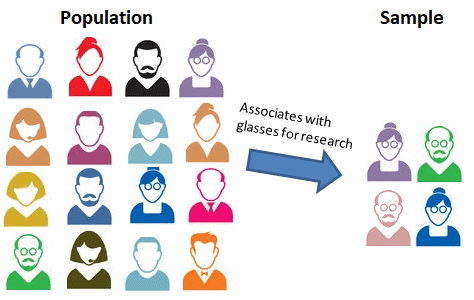
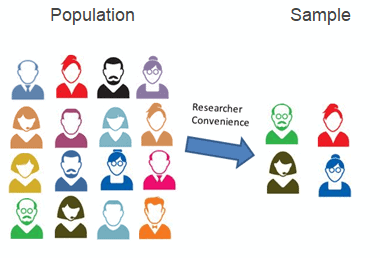
Convenience Sampling: Convenience sampling is one of the easiest sampling methods. Samples selection is based on availability and the selection of convenient samples for the researcher.
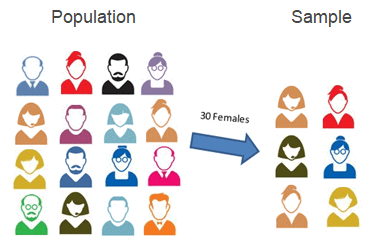
Quota Sampling: It is one type of stratified sampling, where samples are collected in each subgroup until the desired quota is met. The proportion of this sample does not match the proportion of the group to the population.
Snowball/Referral Sampling: Snowball sampling or referral sampling is the method famous in medical and social science surveys where the population is unknown, and difficult to get the sample. Hence researchers will take help from the existing elements to refer the others as samples who can fit in the population. Since it is based on referrals, there is a chance of bias.

Sampling from a Controlled Process:
- Ranges of the samples should vary.
- Means of the samples should be slightly different but be in accordance with the process average and center on some central value.
Kinds of Sampling Bias
Sampling bias is a bias in which samples are collected so that some elements of the intended population have less or more sampling probability than others.
Following are the different types of sampling bias
Response Bias: A response or data bias is a systematic bias that occurs during data collection that influences the response.
Voluntary response Bias: Occurs when individuals can choose to participate.
Non-response Bias: Non-response bias occurs when units selected as part of the sampling procedure do not respond in whole or part.
Convenience Bias: When a sample is taken from individuals that are conveniently available.
Representative Sample
A representative sample refers to a subset selected from a broader statistical population or a collection of factors, ensuring an accurate reflection of the larger group in terms of the specific characteristic or quality being investigated. A few examples like sex, age, education, or marital status.
Increasing the sample size reduces the probability of sampling errors and enhances the probability that the sample effectively mirrors the characteristics of the target population. Representative samples reduce the risk of selection bias, ensuring that all segments of the population have an equal chance of being included in the sample.
Example: In US political polling, a representative sample would encompass diverse demographics, such as age, gender, and geographic location etc.
Homogeneity
Homogeneity in data sampling represents the degree of similarity among elements within a sample. When a sample is homogeneous, its elements share common characteristics, contributing to a more focused and targeted analysis.
While a representative sample aims to encompass the diversity of the entire population, homogeneity becomes particularly important when studying specific traits or characteristics within a subgroup. This focus on similarity enhances the precision and accuracy of results within that particular subset of the population.
Example: A product company is surveying to understand customer preferences for a new product. Despite a diverse customer base in terms of age, income, and geography, the company focuses on studying the preferences of customers aged 21 to 30. This targeted approach ensures homogeneity within the sample, allowing the survey team to gather precise insights from individuals who share the common characteristic of being in the 21 to 30 age group.
Accuracy:
Accuracy in data sampling refers to the degree of conformity between the sample and the true characteristics of the population. Accurate sampling is essential for drawing reliable conclusions. Inaccuracies may lead to incorrect assumptions about the population, affecting the validity and applicability of study results.
Sample Size for Data Sampling
How Large Should a Data Sample Be?
When you pick a sample size, there will always be a trade-off between precision and cost. This trade-off depends on:
- The type of data being sampled (continuous or discrete)
- How precise do you want your statistical inferences to be?
- The estimate of the standard deviation for the entire population.
- The confidence level desired.
Sample size is the number of observations collected from a population; it is a subset of the population to make inferences about the population.
Sample Size Needed for Hypothesis Testing Depends on:
- Desired Risk (Both alpha and beta)
- The minimum value to be detected between the population means
- The variation in the characteristic being measured (S or sigma)–the population variance.
- Population size does NOT come into the determination of how big a population is.
How to Calculate a Sample Size
Sample size determination is the mathematical estimation of the number of population units considered for the study. The sample size must be adequate to represent the population. Here are the most common ways to calculate the sample size.
In terms of Six Sigma, we are usually trying to determine an appropriate sample size for doing one of two things: estimate an average or estimate a proportion. The equation you use to determine your sample size depends on what you’re going to do with that sample.
Either way, the variables are as follows:
n = sample size (what we’re solving for)
d (Sometimes represented as delta or Δ) = precision = the range for estimating a characteristic = half the width of a confidence interval.
Precision in this sense can be a bit tricky, so here are a few examples;
- Estimate of a lead time of +/- 4 days
- Precision would = 4 days
- Estimate of a percent rejected +/- 10%
- Precision would = 10%
- 95% CI (4,10) for a lead time in hours.
- Estimate of a lead time between 4 and 10 hours
- Width of the confidence interval would be = 10-4 hours = 6 hours
- Precision = d = 1/2 of C.I. width = 6/2 = 3 hours
Sample Size to Estimate an Average
n = (2*s/d)^2
Sample Size to Estimate a Proportion
p = proportion
n = ((2/d)^2) (p)(1-p)
Additional Ways to Calculate Sample Size
Sample Size for One Sample, Continuous Outcome

Where n is the sample size, Z is the Z score from the desired risk, sigma is the standard deviation, and E is the mean shift – or error.
Example: A peanut butter manufacturer wants to estimate the sugar content in a bottle. The previous batch of 1000 bottles had a standard deviation of 10 gms. Identify the sample size to estimate the mean is within 4 gms of the population mean with a 95% confidence.
- Margin of error E = 4gm
- Standard deviation = 10gm
First, we need to identify the alpha.
Subtract the confidence level (95%) from 1 and then divide the result by two:
α = (1-.95)/ 2= 0.025
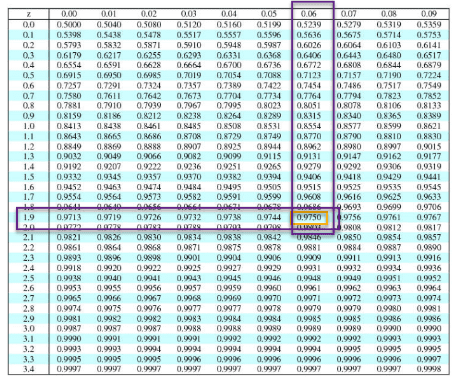
Next, subtract alpha from 1 and then look that is up in the middle of the z table to get the z-score:
1-0.025 = 0.975
Z-score = 1.96
Sample size n = (z* σ/E)2 = (1.96* 10/4)2 = 24.
Also see: https://sphweb.bumc.bu.edu/otlt/mph-modules/bs/bs704_power/BS704_Power3.html
Sample Size for Continuous and Binary Random Variables

Where
n = sample size
p̂ is the variability.
q̂ = 1- p̂
Example: The expectation is that 20% of employees in the New York area are using Subway. With a 90% confidence level, what would be the minimum sample that needs to estimate the population proportion with a maximum permissible difference of 6%?
Sample proportion = 0.20
Margin of error E =0.06
90% confidence level α = 1-0.90 = 0.1; Z =1.645
Sample size n = p̂ (1- p̂)* (Z/E)2 = 0.2*(1-0.2)* (1.645/0.06)2 = 120.26 =121.
See also:
(Cochran’s formula) https://www.statisticshowto.com/probability-and-statistics/find-sample-size/
Sample Size for Discreet Data
Sample Size for a Known or Finite Population
https://blog.remesh.ai/how-to-calculate-sample-size
https://www.calculator.net/sample-size-calculator.html
How to Find a Sample Size Given a Confidence Level and Width (known population standard deviation):
Sample Size for an Unknown or Infinite Population
https://blog.remesh.ai/how-to-calculate-sample-size
https://www.surveymonkey.com/mp/sample-size-calculator/
https://www.calculator.net/sample-size-calculator.html
How to Find a Sample Size Given a Confidence Level and Width (unknown population standard deviation):
Sample Size Using Slovin’s Formula
https://www.statisticshowto.com/how-to-use-slovins-formula/
Sample Size for Other Data Types (Nominal, Ordinal, Interval, Ratio)
See:
How to Calculate a Sample Size Videos
Quantifying Sampling Error
Standard Error
The standard deviation of the means is called the standard error. It quantifies the variation in the means from various sets of measurement data. In other words, it measures uncertainty in the sample mean. If the sample size increases, the standard error is going to decrease.
Standard error = s/√n
s= sample standard deviation
n= sample size
Margin of Error
The margin of error is a statistic expressing the amount of random sampling error in the results of an experiment. The margin of error may decrease when the sample size increases.
Margin of error = z*(s/√n)
s= sample standard deviation
n= sample size
Example: A supervisor collected 36 steel bars with a mean weight of 200 gms and a standard deviation of 20. At a 95% confidence level, find the standard error and margin of error.
n=36
s=20
At a 95% confidence level Z = 1.96
Standard error = s/√n = 20/√36 =3.33
Margin of error = z* (s/√n) = 1.96*(20/√36) =6.533
Data Sampling Videos
ASQ Six Sigma Black Belt Practice Questions
Question: When σ = 10, what sample size is needed to specify a 95% confidence interval of ±3 units from the mean?
(A) 7
(B) 11
(C) 32
(D) 43
Answer:
When you’re ready, there are a few ways I can help:
First, join 30,000+ other Six Sigma professionals by subscribing to my email newsletter. A short read every Monday to start your work week off correctly. Always free.
—
If you’re looking to pass your Six Sigma Green Belt or Black Belt exams, I’d recommend starting with my affordable study guide:
1)→ 🟢Pass Your Six Sigma Green Belt
2)→ ⚫Pass Your Six Sigma Black Belt
You’ve spent so much effort learning Lean Six Sigma. Why leave passing your certification exam up to chance? This comprehensive study guide offers 1,000+ exam-like questions for Green Belts (2,000+ for Black Belts) with full answer walkthroughs, access to instructors, detailed study material, and more.


Comments (11)
would you please enlighten me on application of sampling techniques in English research methods othwerwise thx good presentation
Aruho, I’m sorry, I don’t understand the question. What are you trying to achieve with your data?
This might be a better question in the Z score article, but I’m really confused on how you derived the Z score in your test sample.
Z(47.5) = 1.96, but when I look at the Z score chart, I see 1.96 as .9750. I don’t know how 47.5 and .9750 relate to each other.
Alex,
This answer wasn’t as complete as it should be. I’ve updated with more steps and a clear graphic.
Does this make more sense?
Best, Ted.
Yes, that clears it up!
Thank you for your prompt response
hello Ted,
I think there is an error .
Below the table You wat to mean :
The z–value that has an area of .975 is 1.96 (not: The z–value that has an area of .475 is 1.96).
Is that?
Updated! Thank you for pointing out the typo, Katia.
Hi,
Under ‘Sample Size to Estimate an Average’ section, what is ‘s/d’ and under ‘Sample Size to Estimate a Proportion’ section, what is ‘d’?
Thanks
Hi Daniel Duan,
d is the accuracy of estimate or how close to the true mean and s is the standard deviation.
Thanks
Example: A peanut butter manufacturer wants to estimate the sugar content in a bottle. The previous batch of 1000 bottles had a standard deviation of 10 gms. Identify the sample size to estimate the mean is within 4 gms of the population mean with a 95% confidence.
When I crunch the numbers, I get 24.01. The ASQ BB text book makes a note that n is a ceiling function, which means that you should round up to 25, not down to 24.
Hi Edward,
Rounding up from one one-hundredth looks pretty odd. Could you share the text you’re referring to?
Best, Ted.