A two sample t hypothesis tests also known as independent t-test is used to analyze the difference between two unknown population means. The Two-sample T-test is used when the two small samples (n< 30) are taken from two different populations and compared. The underlying chart makes use of the T distribution.
Assumptions of Two Sample T Hypothesis Tests
The sample should be randomly selected from the two population
Samples are independent to each other
Two sample sizes must me less than 30
Samples collected from the population are normally distributed
When Would You Use a Two Sample T Hypothesis Tests?
The two sample t test most likely used to compare two process means, when the data is having one nominal variable and one measurement variable. It is a hypothesis test of means. Use two sample Z test if the sample size is more than 30.
The two sample hypothesis t tests is used to compare two population means, while analysis of variance (ANOVA) is the best option if more than two group means to be compared.
Two sample T hypotheis tests are performed when the two group samples are statistically independent to each other, while the paired t-test is used to compare the means of two dependent or paired groups.
Note: There are (2) types of Two Sample T Hypothesis tests!
Two Sample T Hypothesis Test (Equal Variance)
Variance of two populations are equal
Two Sample T Hypothesis Test (Unequal Variance)
Variance of two populations are NOT equal
Methods to determine population varince equal or unequal?
The best method to determine population variance is equal or unequal by using an appropriate F-test.
Hypothesis Testing
A tailed hypothesis is an assumption about a population parameter. The assumption may or may not be true. One-tailed hypothesis is a test of hypothesis where the area of rejection is only in one direction. Whereas two-tailed, the area of rejection is in two directions. The selection of one or two-tailed tests depends upon the problem.
Null hypothesis- H0: The population means are same alternatively the difference between two population means are equal to hypothesized difference (d). So, µ1 = µ2 orµ1– µ2 = d
Alternative hypothesis: µ1 ≠ µ2 orµ1– µ2 ≠ d (Two-tailed test)
µ1 < µ2 orµ1– µ2 < d (left-tailed)
µ1 > µ2 orµ1– µ2 > d (Right-tailed)
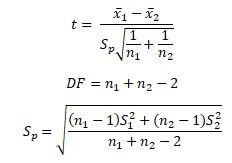
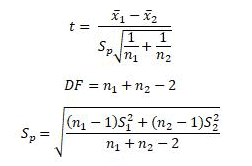
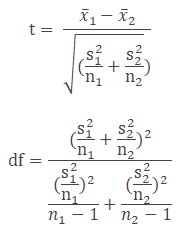
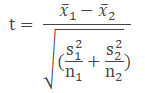
Two Sample T Hypothesis Test (Equal Variance) formula
Where n1 and n2 are sample sizes
x̅1 and x̅2 are means of sample sizes
Sp is the pooled standard deviation
Steps to Calculate Two Sample T Hypothesis Test (Equal Variance)
State the claim of the test and determine the null hypothesis and alternative hypothesis
Determine the level of significance
Calculate degrees of freedom
Find the critical value
Calculate the test statistics
Make a decision, the null hypothesis will be rejected if the test statistic is less than or equal to the critical value
Finally, Interpret the decision in the context of the original claim.
Example of a Two Sample T Hypothesis Test (Equal Variance) in a DMAIC Project
Two Sample T test mostly performed in Analyze phase of DMAIC to evaluate the difference between two process means are really significant or due to random chance, this is basically used to validate the root cause(s) or Critical Xs (see the below example for more detail)
Two-tailed (Equal variance)
Example: Apple orchard farm owner wants to compare the two farms to see if there are any weight difference in the apples. From farm A, randomly collected 15 apples with an average weight of 86 gms, and the standard deviation is 7. From farm B, collected 10 apples with an average weight of 80 gms and standard deviation of 8. With a 95% confidence level, is there any difference in the farms?
Null Hypothesis (H0) : Mean apple weight of farm A is equal to farm B
Alternative Hypothesis (H1) : Mean apple weight of farm A is not equal to farm B
n1=15
n2=10
S12=49
S22 =64
X̅1 =86
X̅2 = 80
Significance level: α=0.05
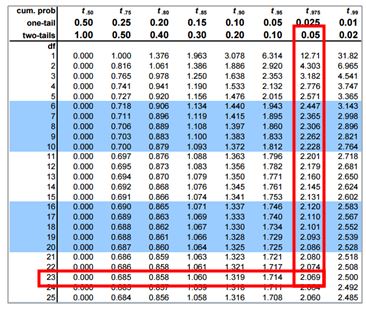
Degrees of freedom df: 15+10-2= 23
Calculate critical value
Refer two tailed t table for 23 degrees of freedom
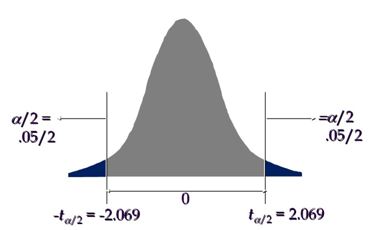
Two Tailed T Test
If the calculated t value is less than -2.069 or greater than 2.069, then reject the null hypothesis.
Test Statistic
Interpret the results:
Compare t calc to t critical . In hypothesis testing, a critical value is a point on the test distribution compares to the test statistic to determine whether to reject the null hypothesis. Calculated t statistic value less than the critical value, hence failed to reject null hypothesis ( H0). So, there is no significant difference between mean weights of apples in farm A and farm B.
Two Sample T 2 Tailed Equal Variance template file
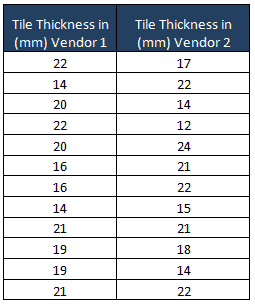
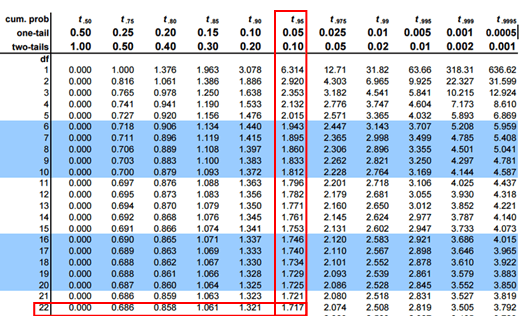
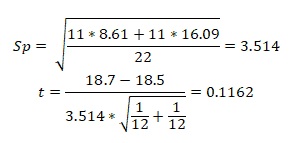
Example: The thickness of ceramic tile of vendor A is slightly greater than the vendor 2. The researcher randomly collected samples from both vendors. Assuming the population variances are equal, at 95% confidence level, is there enough evidence to support the claim?
Null Hypothesis (H0) : Mean tile thickness of vendor A is equal to vendor B
Alternative Hypothesis (H1) : Mean tile thickness of vendor A is greater than vendor B
Refer one tailed t table for 22 degrees of freedom
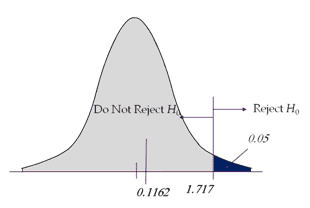
If the calculated t value is greater than 1.717, then reject the null hypothesis.
Test Statistic
Interpret the results:
Compare t calc to t critical . In hypothesis testing, a critical value is a point on the test distribution compares to the test statistic to determine whether to reject the null hypothesis. Calculated t statistic value is less than the critical value and it is not in rejection region, hence failed to reject null hypothesis ( H0). So, there is no significant difference between mean tile thickness of vendor A and vendor B.
Two Sample T Right Tailed Equal Variance template file
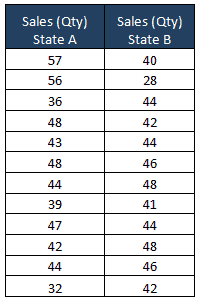
Example: Samples of sales in similar shops in two different US states are taken for a new product with the following results. Is there any evidence that sales in state A is less than the state B. Assuming the population variances are equal, at 95% confidence level, is there enough evidence to support the claim?
Null Hypothesis (H0) : Mean sales in state A is equal to the state B
Alternative Hypothesis (H1) : Mean sales in state A is lesser than state B
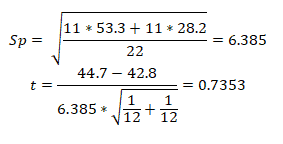
Refer one tailed t table for 22 degrees of freedom
If the calculated t value is less than 1.717, then reject the null hypothesis.
Test Statistic
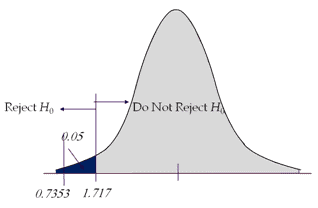
Interpret the results:
Compare t calc to t critical . In hypothesis testing, a critical value is a point on the test distribution compares to the test statistic to determine whether to reject the null hypothesis. Calculated t statistic value is less than the critical value and it is in the rejection region, hence we reject the null hypothesis ( H0). So, mean sales in state A is less than the state B.
Two Sample T Left Tailed Equal Variance template file
Step 5 – Compare t-calc with critical value in the t-distribution table.
Look up the t-critical value in t-distribution table given calculated degrees of freedom in column α (significance level):
For 1 tailed test the t-critical is based on the given α
The commonly used T-critical value for a 1 tailed test is in the 0.05 α column
For 2 tailed test the t-critical is based on the given α divided by 2
The commonly used T-critical value for a 2 tailed test is in the 0.025 α column
INTERPRETATION:
Finally, interpret the decision in the context of the original claim.
Example of a Two Sample T Hypothesis Test (Unequal Variance) in a DMAIC Project
Two-tailed (Unequal Variance)
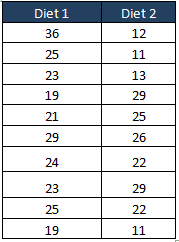
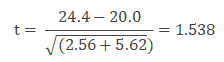
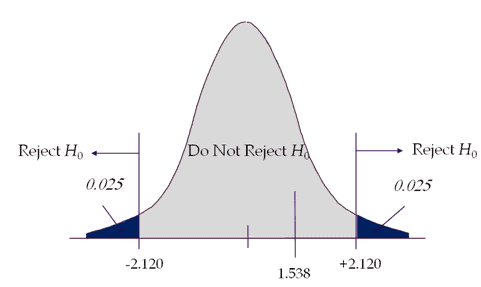
Example: Dogs are fed with two different diets. Test if the two diets differ significantly as regards their effect on their weight. Assuming the population variance is unequal, at 95% confidence level, is there enough evidence to support the claim?
Null Hypothesis (H0) : The mean dog weights are the same with Diet 1 and Diet 2
Alternative Hypothesis (H1) : The mean dog weights are not the same with Diet 1 and Diet 2
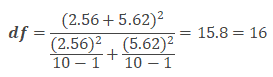
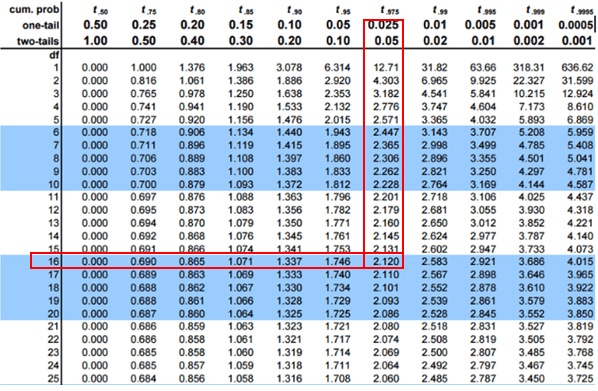
Refer two tailed t table for 16 degrees of freedom
If the calculated t value is less than -2.120 or greater than 2.120, then reject the null hypothesis.
Test Statistic
Interpret the results:
Compare t calc to t critical . In hypothesis testing, a critical value is a point on the test distribution compares to the test statistic to determine whether to reject the null hypothesis. Calculated t statistic value is less than the critical value and it is not in the rejection region, hence we failed to reject the null hypothesis ( H0). So, the mean dog weights are the same with Diet 1 and Diet 2.
Two Sample T 2 Tailed Unqual Variance template file
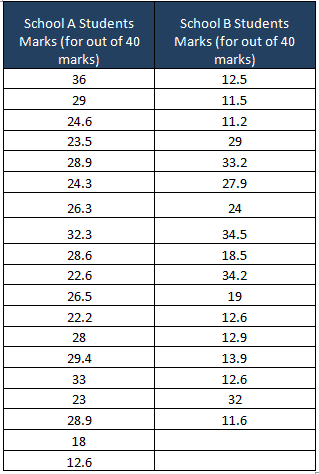
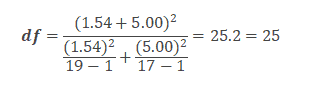
Example: A researcher believes that students in school A have better computer knowledge than school B. Randomly computer marks were collected from the two schools for the same curriculum. Assuming the population variance is unequal, at 95% confidence level, is there enough evidence to support the claim?
Null Hypothesis (H0) : Mean students marks in school A is equal to the school B
Alternative Hypothesis (H1) : Mean students marks in school A is greater than the school B
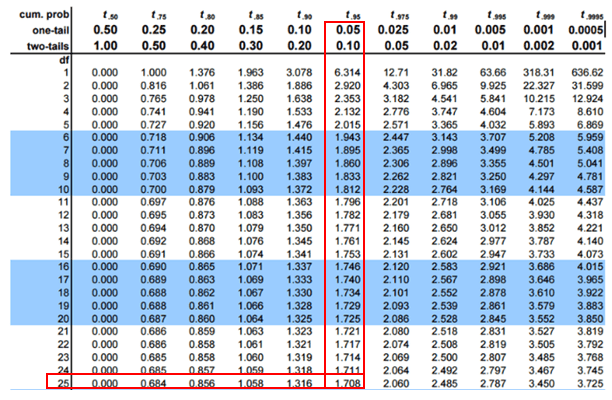
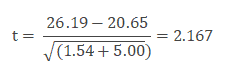
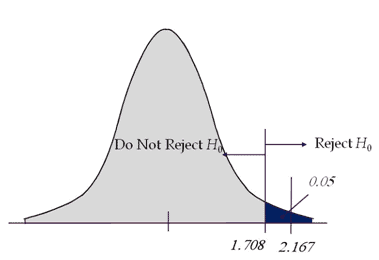
Refer one tailed t table for 25 degrees of freedom
If the calculated t value is greater than 1.708, then reject the null hypothesis.
Test Statistic
Interpret the results:
Compare t calc to t critical . In hypothesis testing, a critical value is a point on the test distribution compares to the test statistic to determine whether to reject the null hypothesis. Calculated t statistic value is greater than the critical value and it is in the rejection region, hence we reject the null hypothesis ( H0). So, the mean students marks in school A is greater than the school B.
Two Sample T Right Tailed Unequal Variance template file
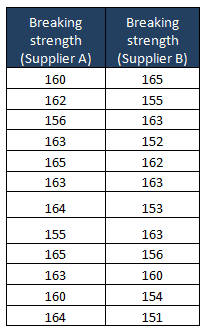
Example: A manufacturer believes that breaking strength of plastic parts of supplier A is less than the supplier B. Operator randomly checked the breaking strength of plastic parts of two suppliers. Assuming the population variance is unequal, at 95% confidence level, is there enough evidence to support the claim?
Null Hypothesis (H0) : Mean breaking strength of plastic parts of supplier A is equal to the supplier B
Alternative Hypothesis (H1) : Mean breaking strength of plastic parts of supplier A is less than supplier B
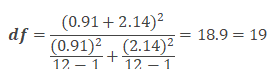
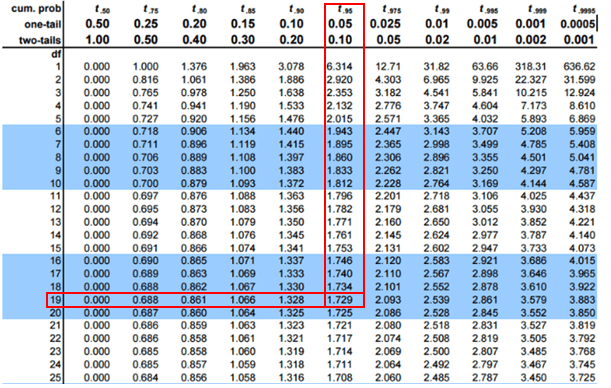
Refer one tailed t table for 19 degrees of freedom
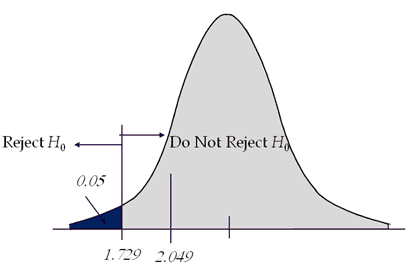
If the calculated t value is less than 1.728, then reject the null hypothesis.
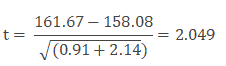
Test Statistic
Interpret the results:
Compare t calc to t critical . In hypothesis testing, a critical value is a point on the test distribution compares to the test statistic to determine whether to reject the null hypothesis. Calculated t statistic value is greater than the critical value and it is not in the rejection region, hence we failed to reject the null hypothesis ( H0). So, Mean breaking strength of plastic parts of supplier A is equal to the supplier B.
Two Sample T Left Tailed Unequal Variance template file
When you’re ready, there are a few ways I can help:
First, join 30,000+ other Six Sigma professionals by subscribing to my email newsletter. A short read every Monday to start your work week off correctly. Always free.
—
If you’re looking to pass your Six Sigma Green Belt or Black Belt exams, I’d recommend starting with my affordable study guide:
You’ve spent so much effort learning Lean Six Sigma. Why leave passing your certification exam up to chance? This comprehensive study guide offers 1,000+ exam-like questions for Green Belts (2,000+ for Black Belts) with full answer walkthroughs, access to instructors, detailed study material, and more.
I originally created SixSigmaStudyGuide.com to help me prepare for my own Black belt exams. Overtime I've grown the site to help tens of thousands of Six Sigma belt candidates prepare for their Green Belt & Black Belt exams. Go here to learn how to pass your Six Sigma exam the 1st time through!
When we divide by n in the sample variance S2, it is not an unbiased estimate of the population variance. Hence it is always recommended to use n-1 instead of n.
The formula for Two Sample T Hypothesis Test (Unequal Variance) formula that you have doesn’t match the formula shown on the IASSC formula sheet. Specifically A = sqrt(s1^2/n1), B = sqrt(s2^2/n2) and the way you’ve shown it you have A = s1^2/n1, B = s2^2/n2. Please update.


Comments (7)
In the blood pressure question, can you please explain how you got 7.3 for s? No matter what I do, I am always getting to 7.08
Thanks for the head’s up, Jeremy. I see an opportunity for improvement on both of the examples listed. I’ll update asap.
Jeremy,
I added additional detail in the calculation steps.
For these equations with so many variables I find it helpful to go slowly and write out the smaller operations of each part of the calculation.
Does this make sense?
Hi,
the above states formula for Sample Variation as
S2 = {( X Bar– x1)2 + (X Bar – x2)2 + … +(X Bar – xn)2} / n
however the IASSC Reference document is stating
S2 = {( X Bar– x1)2 + (X Bar – x2)2 + … +(X Bar – xn)2} / n-1
Could you please clarify
Thanks
Maria
Thank you Maria,
When we divide by n in the sample variance S2, it is not an unbiased estimate of the population variance. Hence it is always recommended to use n-1 instead of n.
I have updated the formula
Thanks
The formula for Two Sample T Hypothesis Test (Unequal Variance) formula that you have doesn’t match the formula shown on the IASSC formula sheet. Specifically A = sqrt(s1^2/n1), B = sqrt(s2^2/n2) and the way you’ve shown it you have A = s1^2/n1, B = s2^2/n2. Please update.
Hello Gariel Smith,
The formula and calculations are correct, we cross-checked with the Quality Council of Indiana Book as well as the below websites.
https://www.real-statistics.com/students-t-distribution/two-sample-t-test-uequal-variances/
https://www.theopeneducator.com/doe/hypothesis-Testing-Inferential-Statistics-Analysis-of-Variance-ANOVA/Two-Sample-T-Test-Unequal-Variance
Thanks
Ramana